Fig. 16
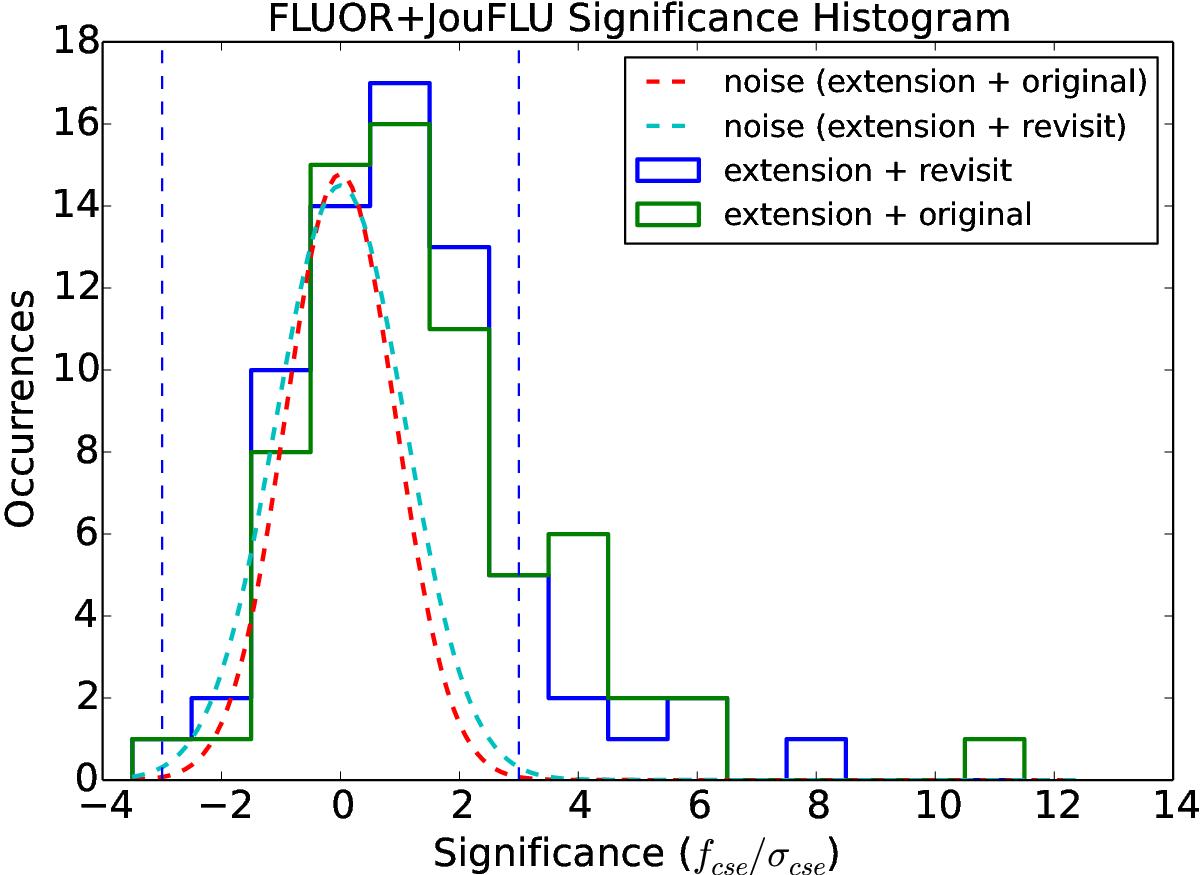
JouFLU and FLUOR samples combined. The blue histogram includes the JouFLU survey and the revisited (follow-up) targets with JouFLU. The blue histogram shows uses the original significance values for the follow-up targets obtained by Absil et al. (2013). The dotted lines are the estimated instrumental noise significance distributions for the two different ways of combining the JouFLU and FLUOR observations.
Current usage metrics show cumulative count of Article Views (full-text article views including HTML views, PDF and ePub downloads, according to the available data) and Abstracts Views on Vision4Press platform.
Data correspond to usage on the plateform after 2015. The current usage metrics is available 48-96 hours after online publication and is updated daily on week days.
Initial download of the metrics may take a while.