Fig. 12
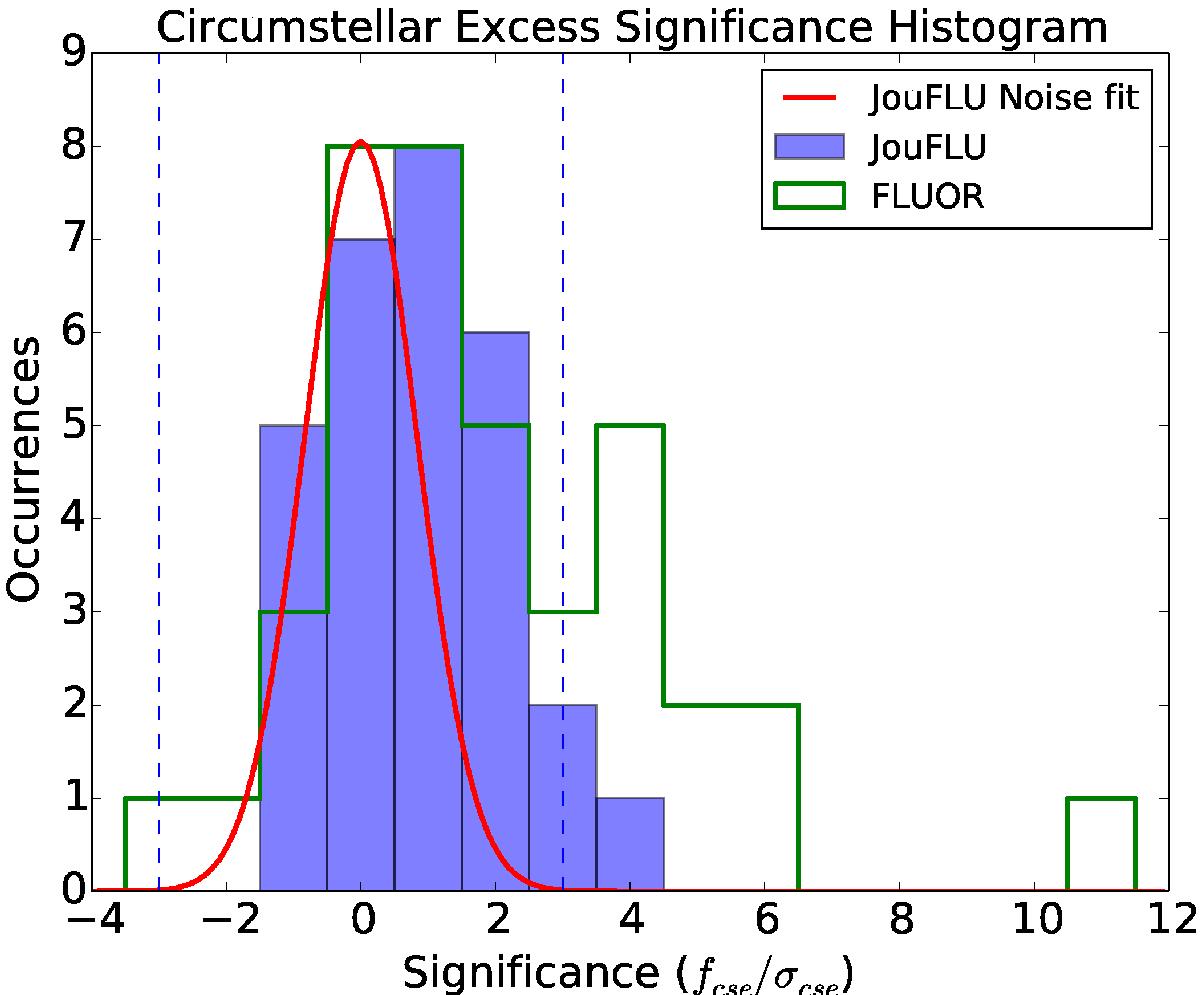
Significance histogram for the JouFLU survey shown in blue, and for the FLUOR survey (Absil et al. 2013) shown in green. The red curve is an estimate of the instrumental noise of JouFLU, which is computed by fitting a Gaussian to a symmetrized JouFLU distribution around zero. The difference between the instrumental noise and the JouFLU significance distribution allows to estimate the number of undetected excesses, which is around ~ 9.
Current usage metrics show cumulative count of Article Views (full-text article views including HTML views, PDF and ePub downloads, according to the available data) and Abstracts Views on Vision4Press platform.
Data correspond to usage on the plateform after 2015. The current usage metrics is available 48-96 hours after online publication and is updated daily on week days.
Initial download of the metrics may take a while.