Fig. 4
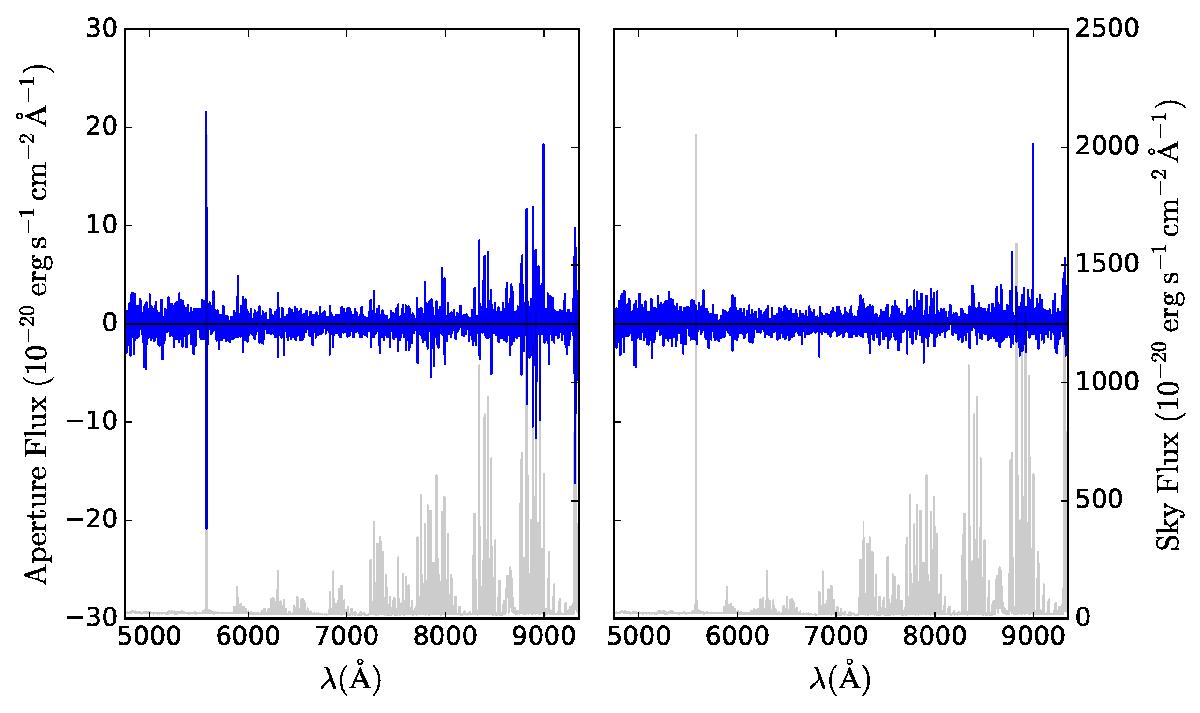
Spectrum extracted from a 1′′ diameter aperture in an empty region of a single exposure datacube, before (left panel) and after (right panel) the use of ZAP. The mean sky spectrum is shown in light gray.
Current usage metrics show cumulative count of Article Views (full-text article views including HTML views, PDF and ePub downloads, according to the available data) and Abstracts Views on Vision4Press platform.
Data correspond to usage on the plateform after 2015. The current usage metrics is available 48-96 hours after online publication and is updated daily on week days.
Initial download of the metrics may take a while.