Fig. 26
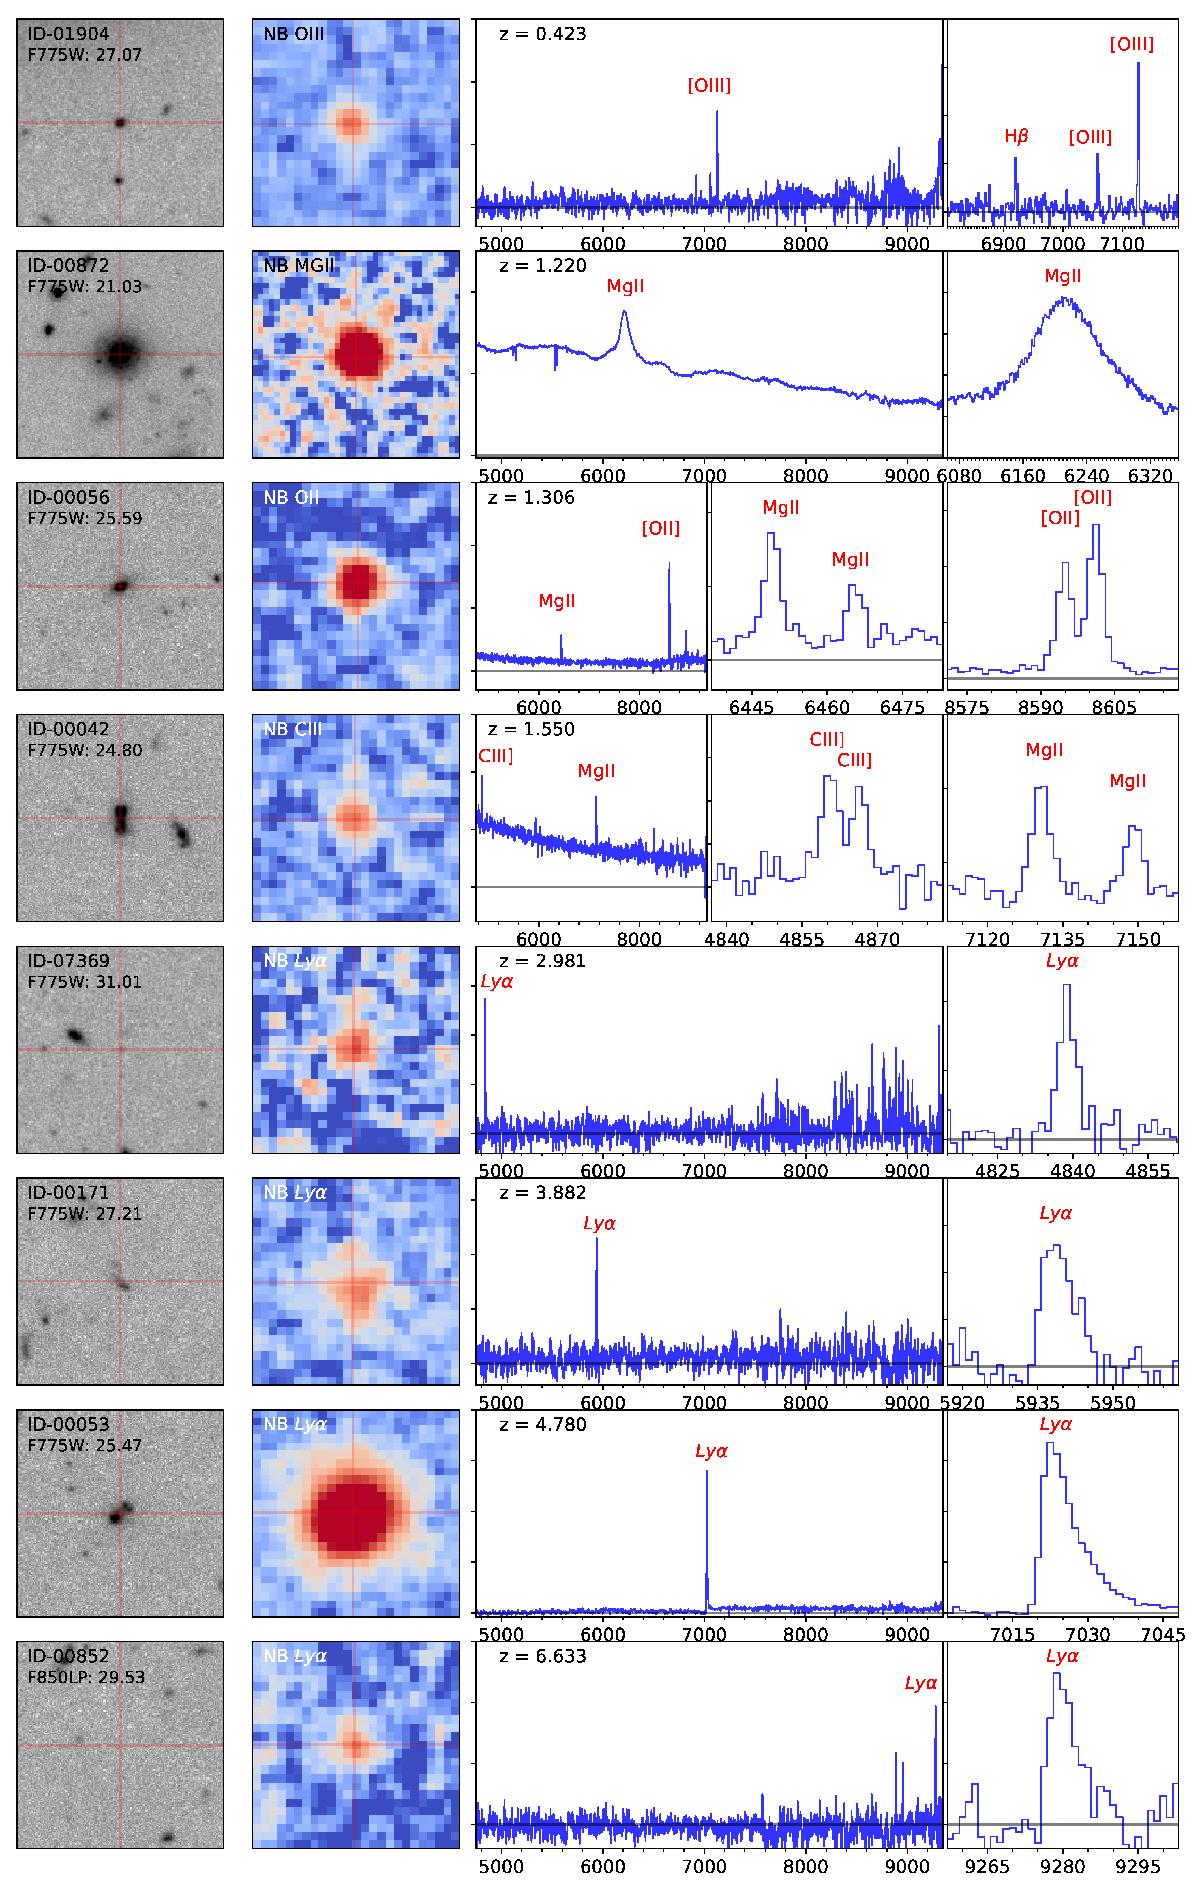
Example of sources from the mosaic and udf-10 fields. Each row shows a different object, ordered by redshift. From left to right one can see: the HST broadband image (F775W filter), a MUSE-reconstructed narrow-band image of one of the brightest emission lines, the source spectrum over the full wavelength range and a zoom-in region highlighting some characteristic emission lines. The images have a linear size of 5′′ and the source center is displayed as a red cross-hair.
Current usage metrics show cumulative count of Article Views (full-text article views including HTML views, PDF and ePub downloads, according to the available data) and Abstracts Views on Vision4Press platform.
Data correspond to usage on the plateform after 2015. The current usage metrics is available 48-96 hours after online publication and is updated daily on week days.
Initial download of the metrics may take a while.