Fig. 25
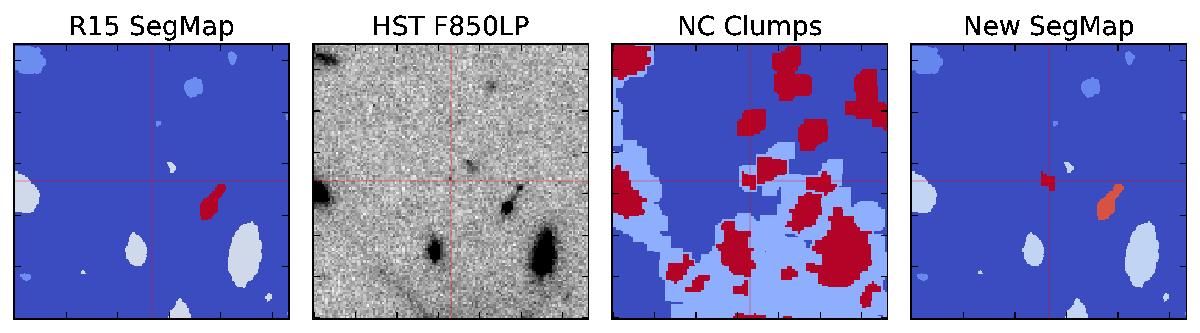
Complementing the Rafelski et al. (2015) segmentation map with NoiseChisel on source ID 6524 (see also Fig. 23a). Note that images are displayed in the original HST grid (rotated by − 42° compared to Fig. 23a). Image size is 8′′ and the target is in the center (shown by the red crosshair). From left to right: the Rafelski et al. (2015) segmentation map, the input F850LP image, NoiseChisel clumps (red) over diffuse detections (light blue), and the final segmentation map, with the central clump of the previous image added to the input segmentation map. Note how some red regions in the NoiseChisel clumps image are not surrounded by diffuse flux (light blue). The measured magnitude is 29.49±0.18 in the F850LP filter. See Sect. 7.3 for more details.
Current usage metrics show cumulative count of Article Views (full-text article views including HTML views, PDF and ePub downloads, according to the available data) and Abstracts Views on Vision4Press platform.
Data correspond to usage on the plateform after 2015. The current usage metrics is available 48-96 hours after online publication and is updated daily on week days.
Initial download of the metrics may take a while.