Fig. 23
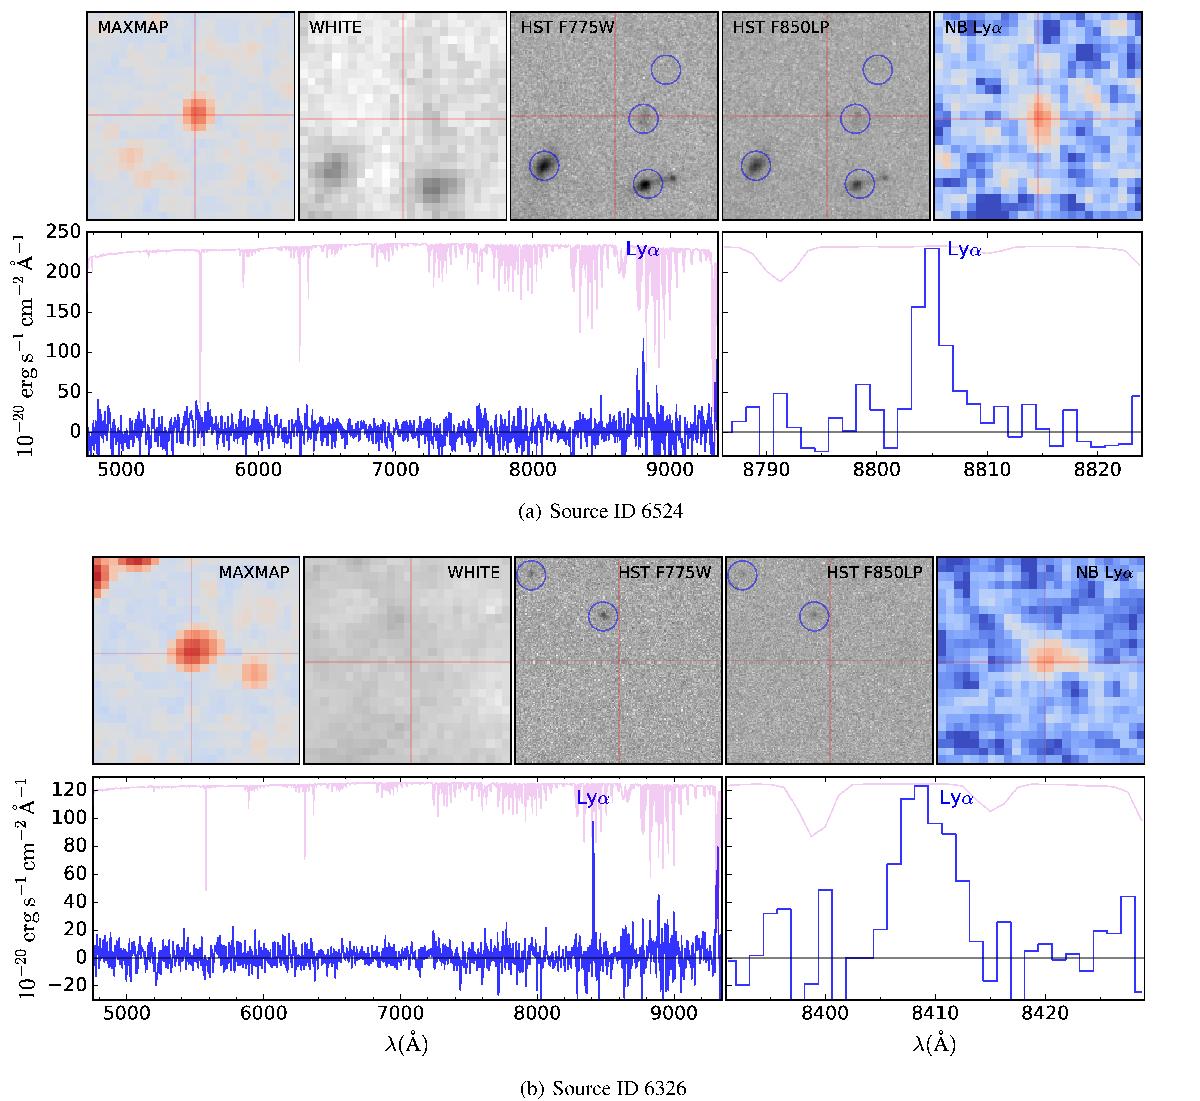
On top, from left to right: ORIGIN MAXMAP image, MUSE reconstructed white light image, HST images in the F775W and F850LP filters, and Lyα narrow-band image. Image size is 5′′ and the source center is indicated by a red crosshair. The blue circles mark the sources identified in the Rafelski catalog. Bottom: source spectrum over the whole wavelength range (box-filtered with a window of 5 pixels) and zoomed (unfiltered) around the Lyα line. The noise standard deviation is shown in magenta (mirrored with respect to the source spectra).
Current usage metrics show cumulative count of Article Views (full-text article views including HTML views, PDF and ePub downloads, according to the available data) and Abstracts Views on Vision4Press platform.
Data correspond to usage on the plateform after 2015. The current usage metrics is available 48-96 hours after online publication and is updated daily on week days.
Initial download of the metrics may take a while.