Fig. 21
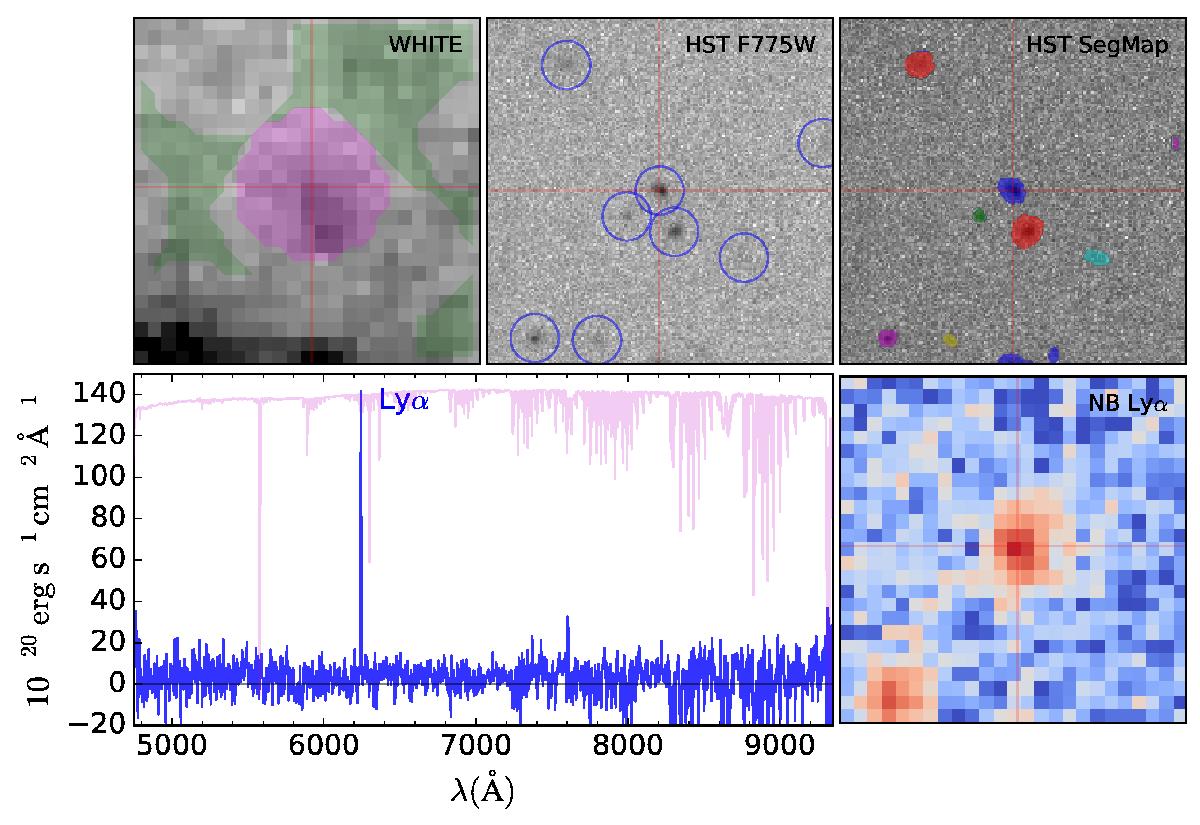
Source ID 6698 from the udf-10 datacubes. On top, from left to right, one can see the MUSE reconstructed white light image, the HST image in F775W and the HST Rafelski segmentation map. Image size is 5′′ and the source center is indicated by a red crosshair. The blue circles mark the sources identified in the Rafelski catalog. The central Rafelski source ID is 4451 and its F775W AB magnitude is 27.92 ± 0.04. The source and background masks are overlaid on the MUSE white light image in magenta and green colors, respectively. Bottom left: PSF weighted extracted source spectrum over the whole wavelength range (box-filtered with a window of 5 pixels). The noise standard deviation is shown in magenta (mirrored with respect to the source spectra). Bottom right: Lyα Narrow-Band image.
Current usage metrics show cumulative count of Article Views (full-text article views including HTML views, PDF and ePub downloads, according to the available data) and Abstracts Views on Vision4Press platform.
Data correspond to usage on the plateform after 2015. The current usage metrics is available 48-96 hours after online publication and is updated daily on week days.
Initial download of the metrics may take a while.