Fig. 20
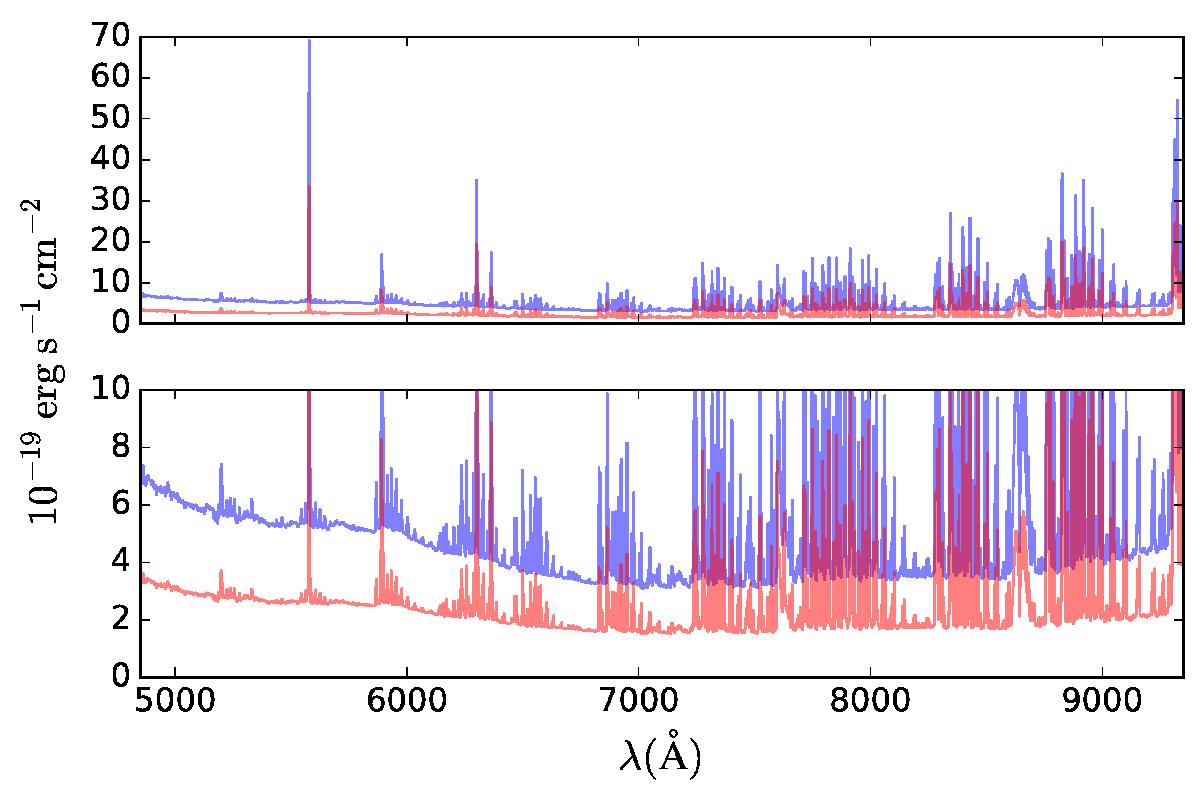
3σ emission line flux detection limit for point-like sources for the mosaic at 10 h integration time (in blue) and udf-10 at 31 h integration time (in red) datacubes. The full scale sky lines dominated limiting flux is shown in the top panel, while values outside bright sky lines are shown in the bottom panel.
Current usage metrics show cumulative count of Article Views (full-text article views including HTML views, PDF and ePub downloads, according to the available data) and Abstracts Views on Vision4Press platform.
Data correspond to usage on the plateform after 2015. The current usage metrics is available 48-96 hours after online publication and is updated daily on week days.
Initial download of the metrics may take a while.