Fig. 15
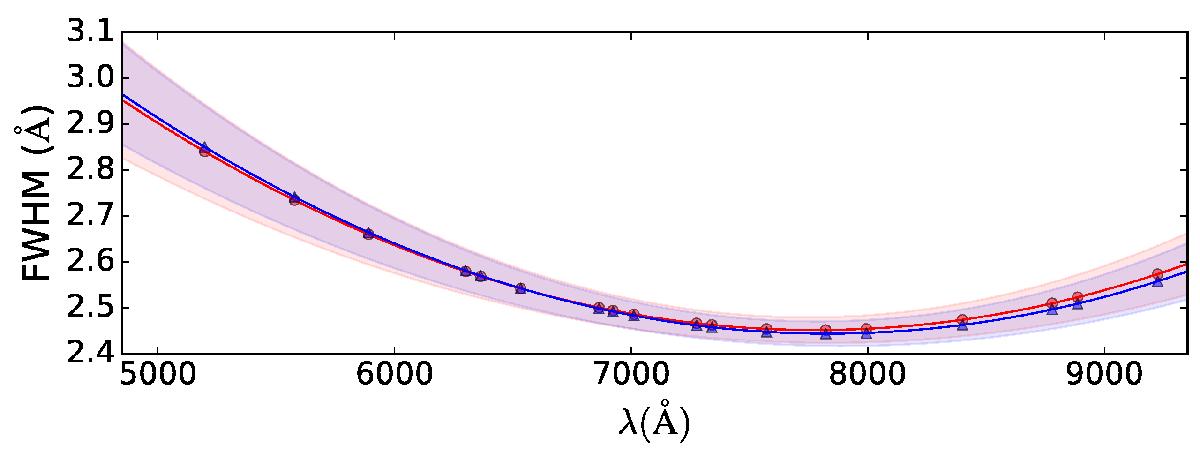
Measured mean LSF FWHM on the udf-10 (blue line) and mosaic (red line) datacubes. The symbols represent measured values while the solid line represents the polynomial fit. The shaded area shows the ± 1σ spatial standard deviation.
Current usage metrics show cumulative count of Article Views (full-text article views including HTML views, PDF and ePub downloads, according to the available data) and Abstracts Views on Vision4Press platform.
Data correspond to usage on the plateform after 2015. The current usage metrics is available 48-96 hours after online publication and is updated daily on week days.
Initial download of the metrics may take a while.