Fig. 13
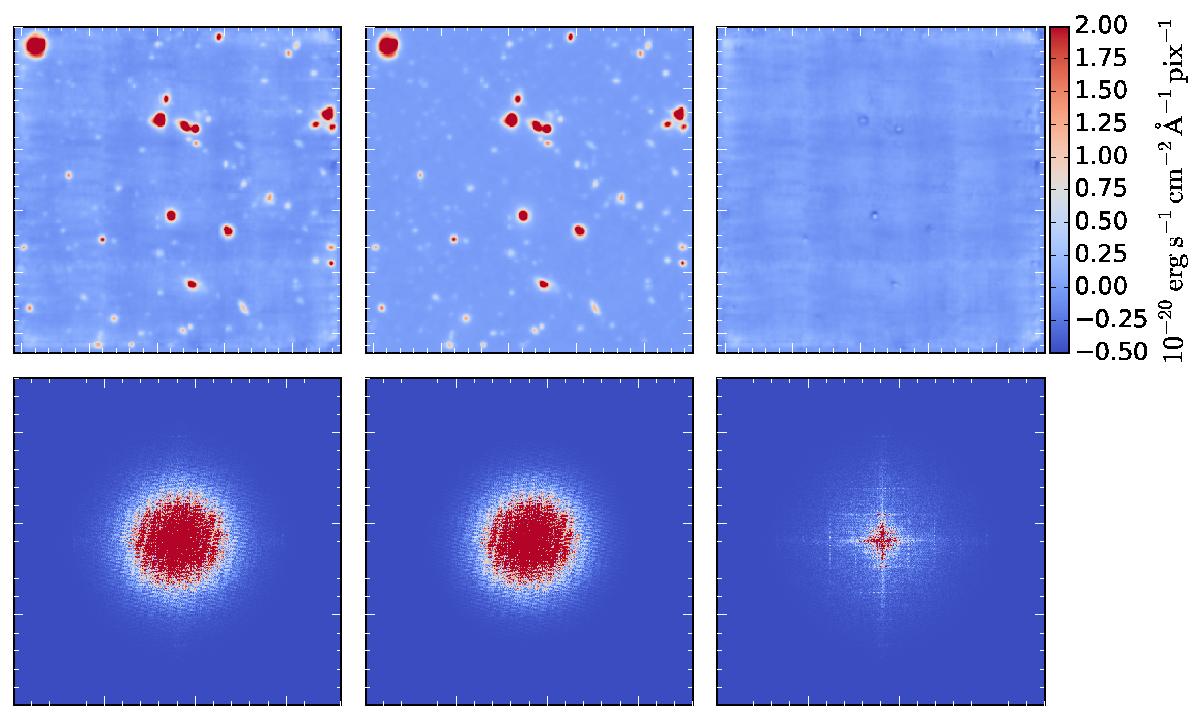
An example demonstrating the success of the FSF fitting technique. The upper left panel shows the udf-10 data, rescaled by the equivalent HST F775W broadband filter. The upper middle panel shows the corresponding HST F775W image, after it has been resampled onto the pixel grid of the MUSE image and convolved with the best-fit MUSE FSF. The upper right panel presents the residual of these two images, showing that only the instrumental background of the MUSE image remains. The lower panels show the corresponding images in the Fourier space where the fit is performed.
Current usage metrics show cumulative count of Article Views (full-text article views including HTML views, PDF and ePub downloads, according to the available data) and Abstracts Views on Vision4Press platform.
Data correspond to usage on the plateform after 2015. The current usage metrics is available 48-96 hours after online publication and is updated daily on week days.
Initial download of the metrics may take a while.