Fig. 12
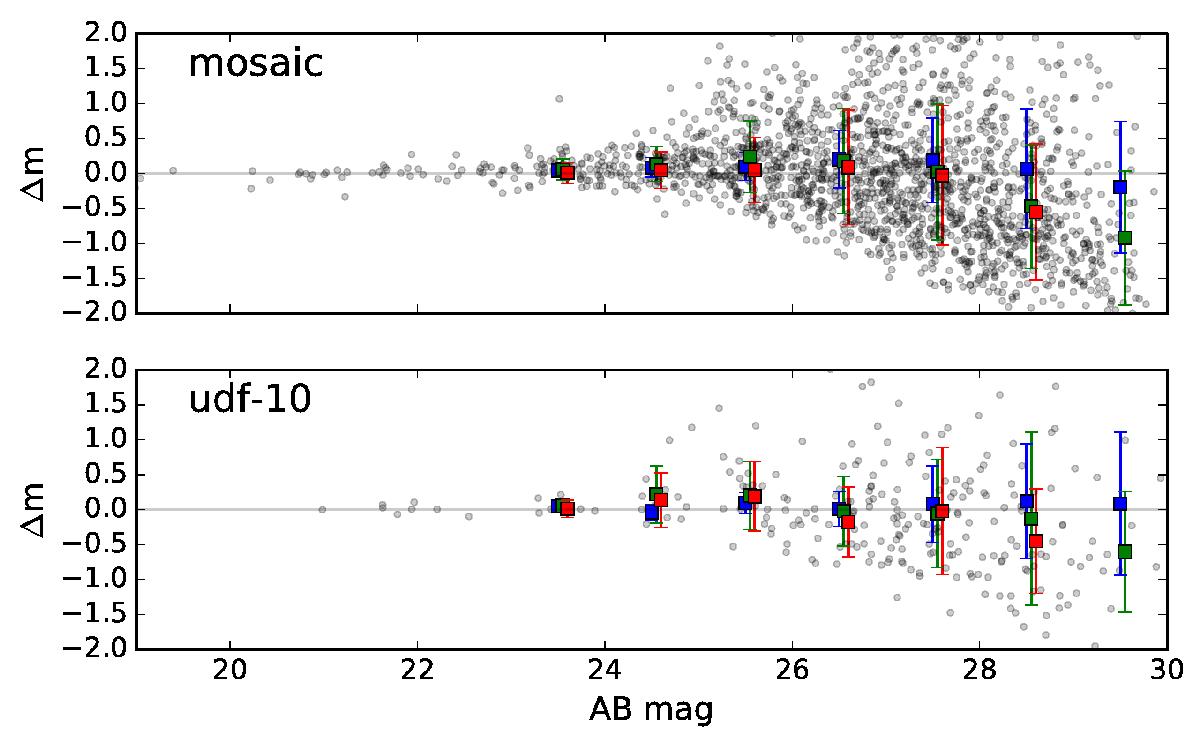
Differences between MUSE and HST AB broadband magnitudes. The gray points show the individual measurements for the F775W filter. The mean AB photometric errors and their standard deviations in HST magnitude bins are shown as error bars, color coded by HST filter: blue (F606W), green (F775W) and red (F814W). Top and bottom panels respectively show the mosaic and udf-10 fields.
Current usage metrics show cumulative count of Article Views (full-text article views including HTML views, PDF and ePub downloads, according to the available data) and Abstracts Views on Vision4Press platform.
Data correspond to usage on the plateform after 2015. The current usage metrics is available 48-96 hours after online publication and is updated daily on week days.
Initial download of the metrics may take a while.