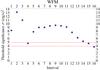
Fig. 4
Threshold significance σ as a function of the interval for BeppoSAX, BATSE, INTEGRAL, and WFM. The red, horizontal lines represent the σ0 threshold as calculated from 1 (see also Band et al. 1993). In the case of BeppoSax, BATSE, and WFM, we report two horizontal lines because the value of the threshold σ0 depends on the angle between the direction perpendicular to the plane of the detector and the direction of the source. We use the lower value throughout the whole analysis.
Current usage metrics show cumulative count of Article Views (full-text article views including HTML views, PDF and ePub downloads, according to the available data) and Abstracts Views on Vision4Press platform.
Data correspond to usage on the plateform after 2015. The current usage metrics is available 48-96 hours after online publication and is updated daily on week days.
Initial download of the metrics may take a while.