Free Access
Fig. 9
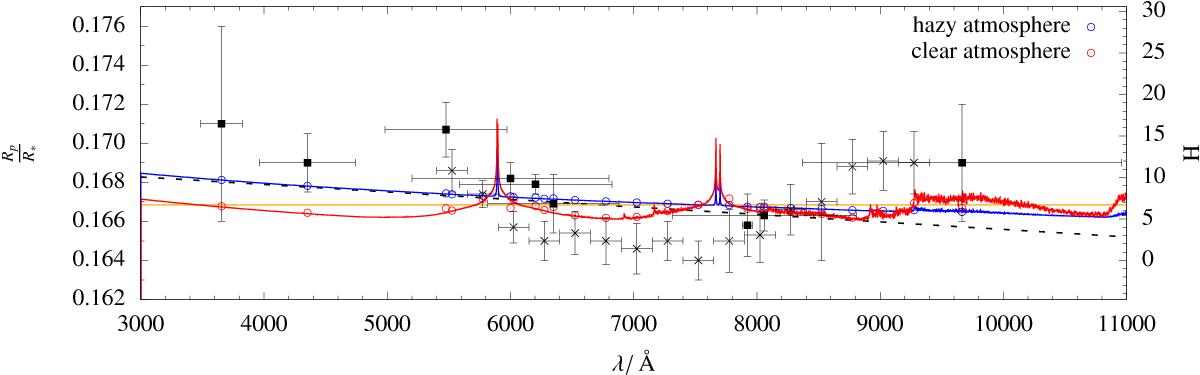
Model atmospheres for a clear and an atmosphere with haze fitted to the transmission spectrum of TrES-3b. The measurements are plotted in black. The binned model data are indicated as coloured circles. Additionally, a constant (orange solid line) and a linear best fit (dashed black line) are shown.
Current usage metrics show cumulative count of Article Views (full-text article views including HTML views, PDF and ePub downloads, according to the available data) and Abstracts Views on Vision4Press platform.
Data correspond to usage on the plateform after 2015. The current usage metrics is available 48-96 hours after online publication and is updated daily on week days.
Initial download of the metrics may take a while.