Fig. 8
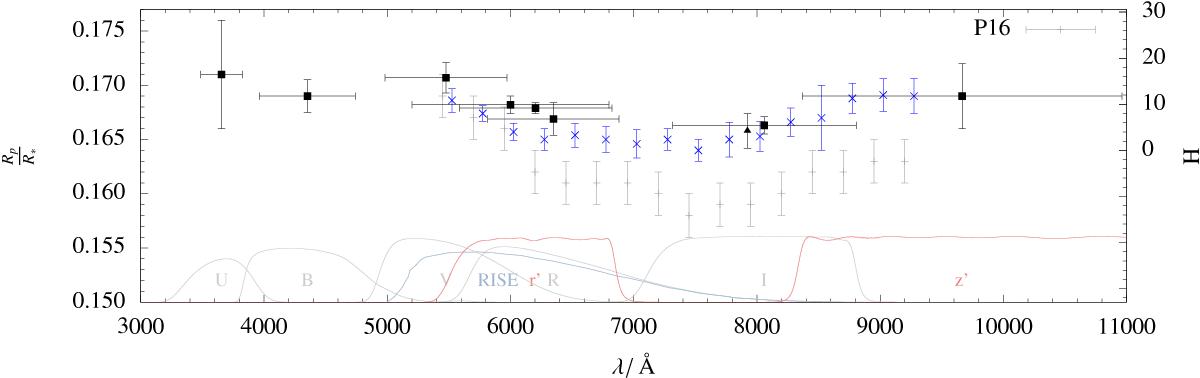
Transmission spectrum of TrES-3 b. Shown is the GTC/OSIRS spectrum (crosses). The broadband photometry is indicated with squares. The response function for each photometric band is shown at the bottom. Horizontal error-bars indicate the FWHM of the band. The narrow band observations by Colón et al. (2010) are indicated with a triangle. The results of the previous study by P16, their Fig. 9, are shown for comparison with an arbitrary offset of -75 Å for clarity. All vertical error-bars indicate the 1 σ uncertainty.
Current usage metrics show cumulative count of Article Views (full-text article views including HTML views, PDF and ePub downloads, according to the available data) and Abstracts Views on Vision4Press platform.
Data correspond to usage on the plateform after 2015. The current usage metrics is available 48-96 hours after online publication and is updated daily on week days.
Initial download of the metrics may take a while.