Free Access
Fig. 3
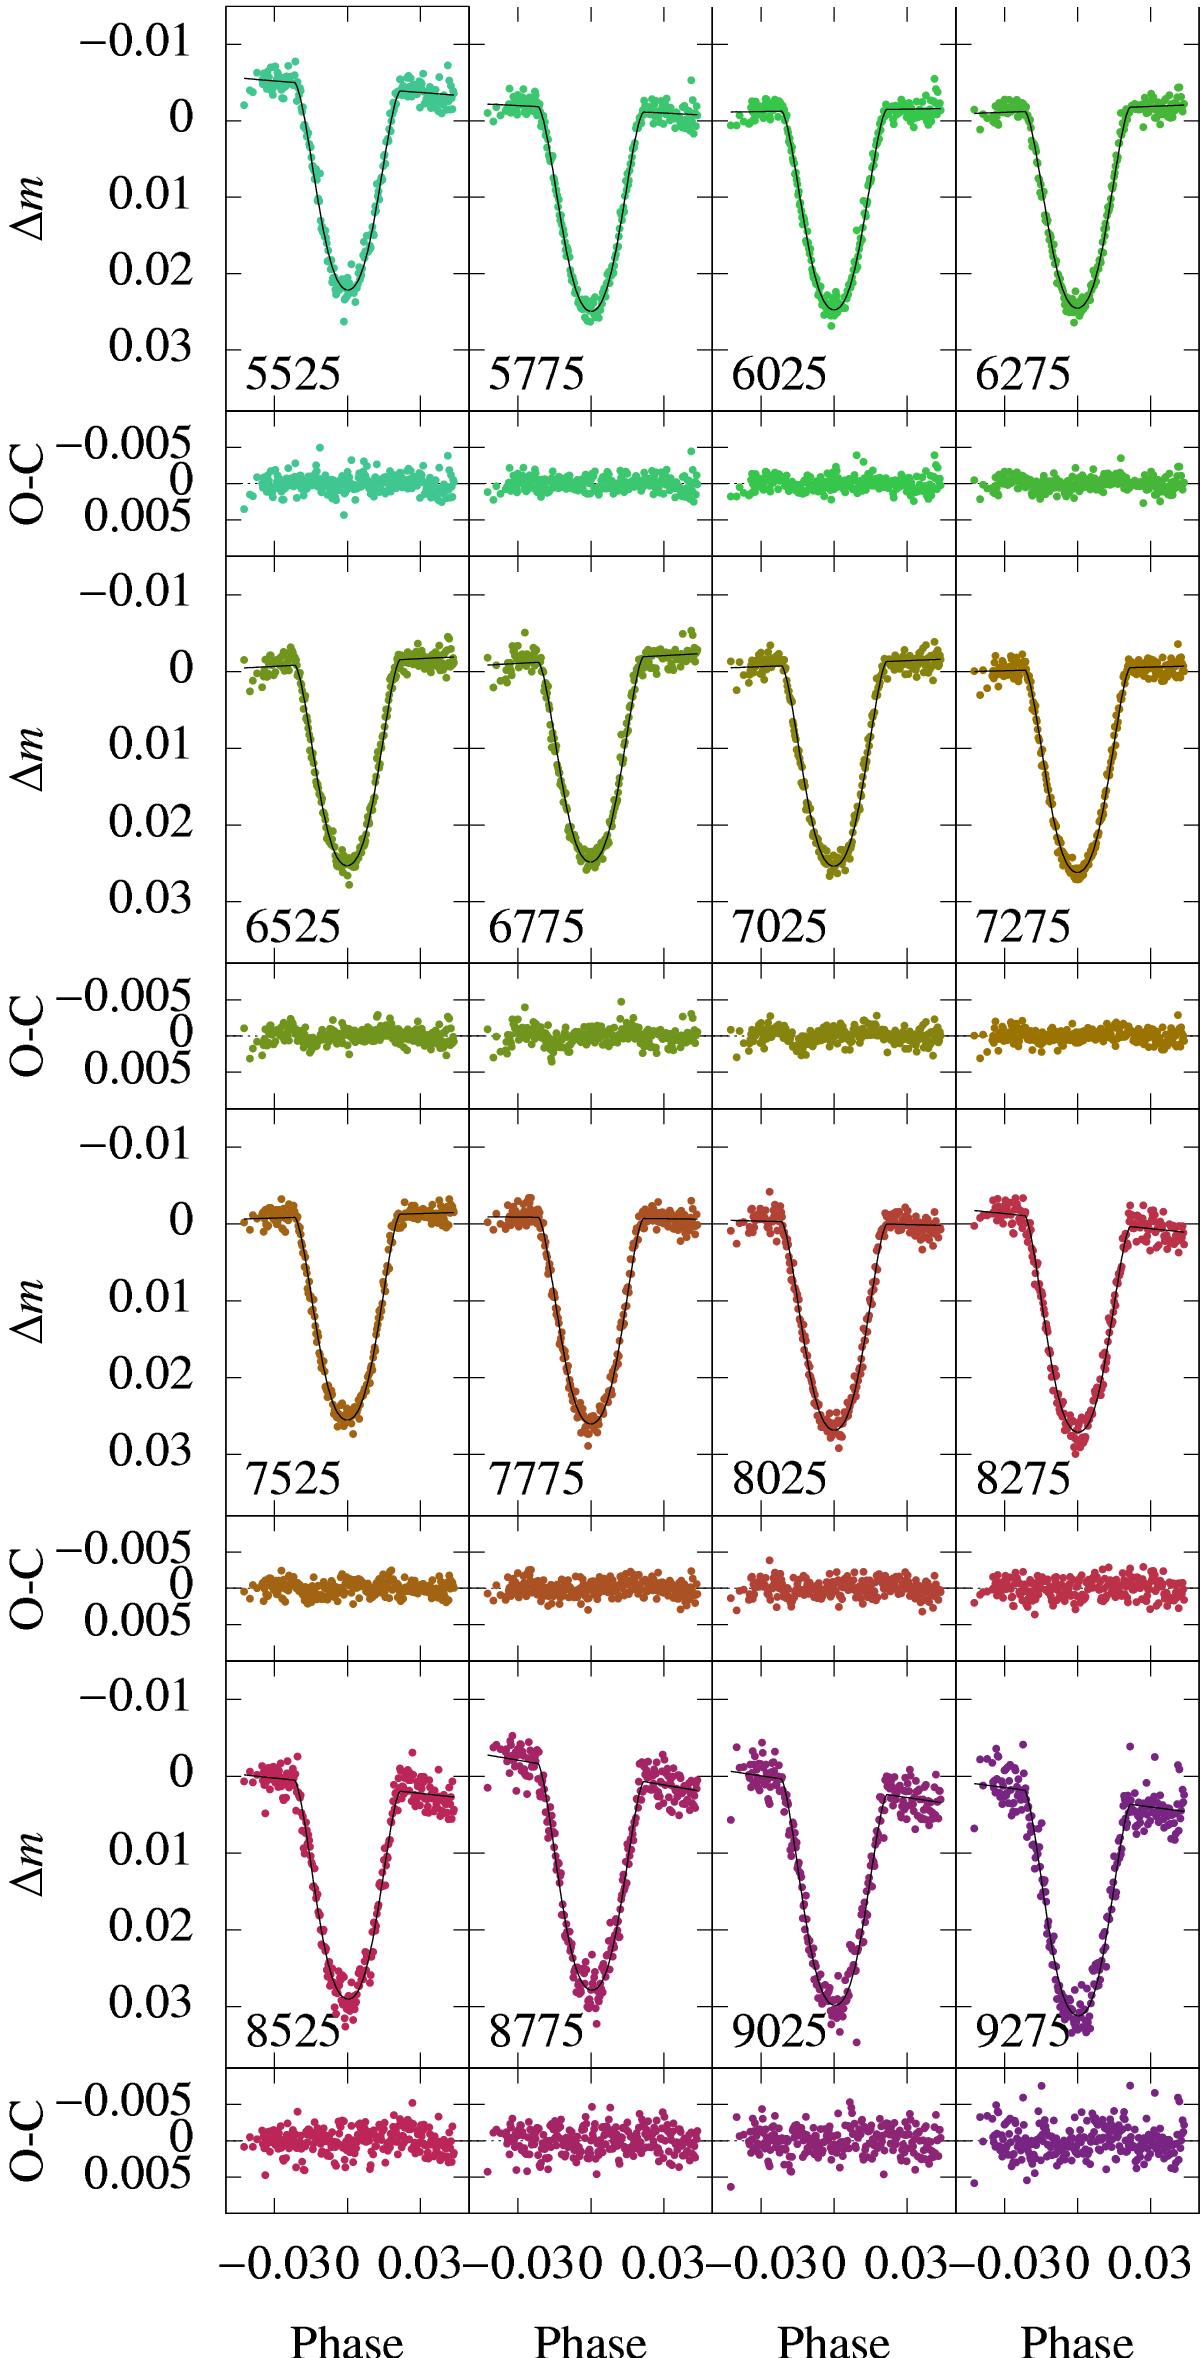
Sixteen channel GTC light curves. Upper panels: light curves with best fit model in black. Labels indicate the middle of the spectral bin, each with a spectral width of 250 Å. Lower panels: residuals of best fit model.
Current usage metrics show cumulative count of Article Views (full-text article views including HTML views, PDF and ePub downloads, according to the available data) and Abstracts Views on Vision4Press platform.
Data correspond to usage on the plateform after 2015. The current usage metrics is available 48-96 hours after online publication and is updated daily on week days.
Initial download of the metrics may take a while.