Fig. 1
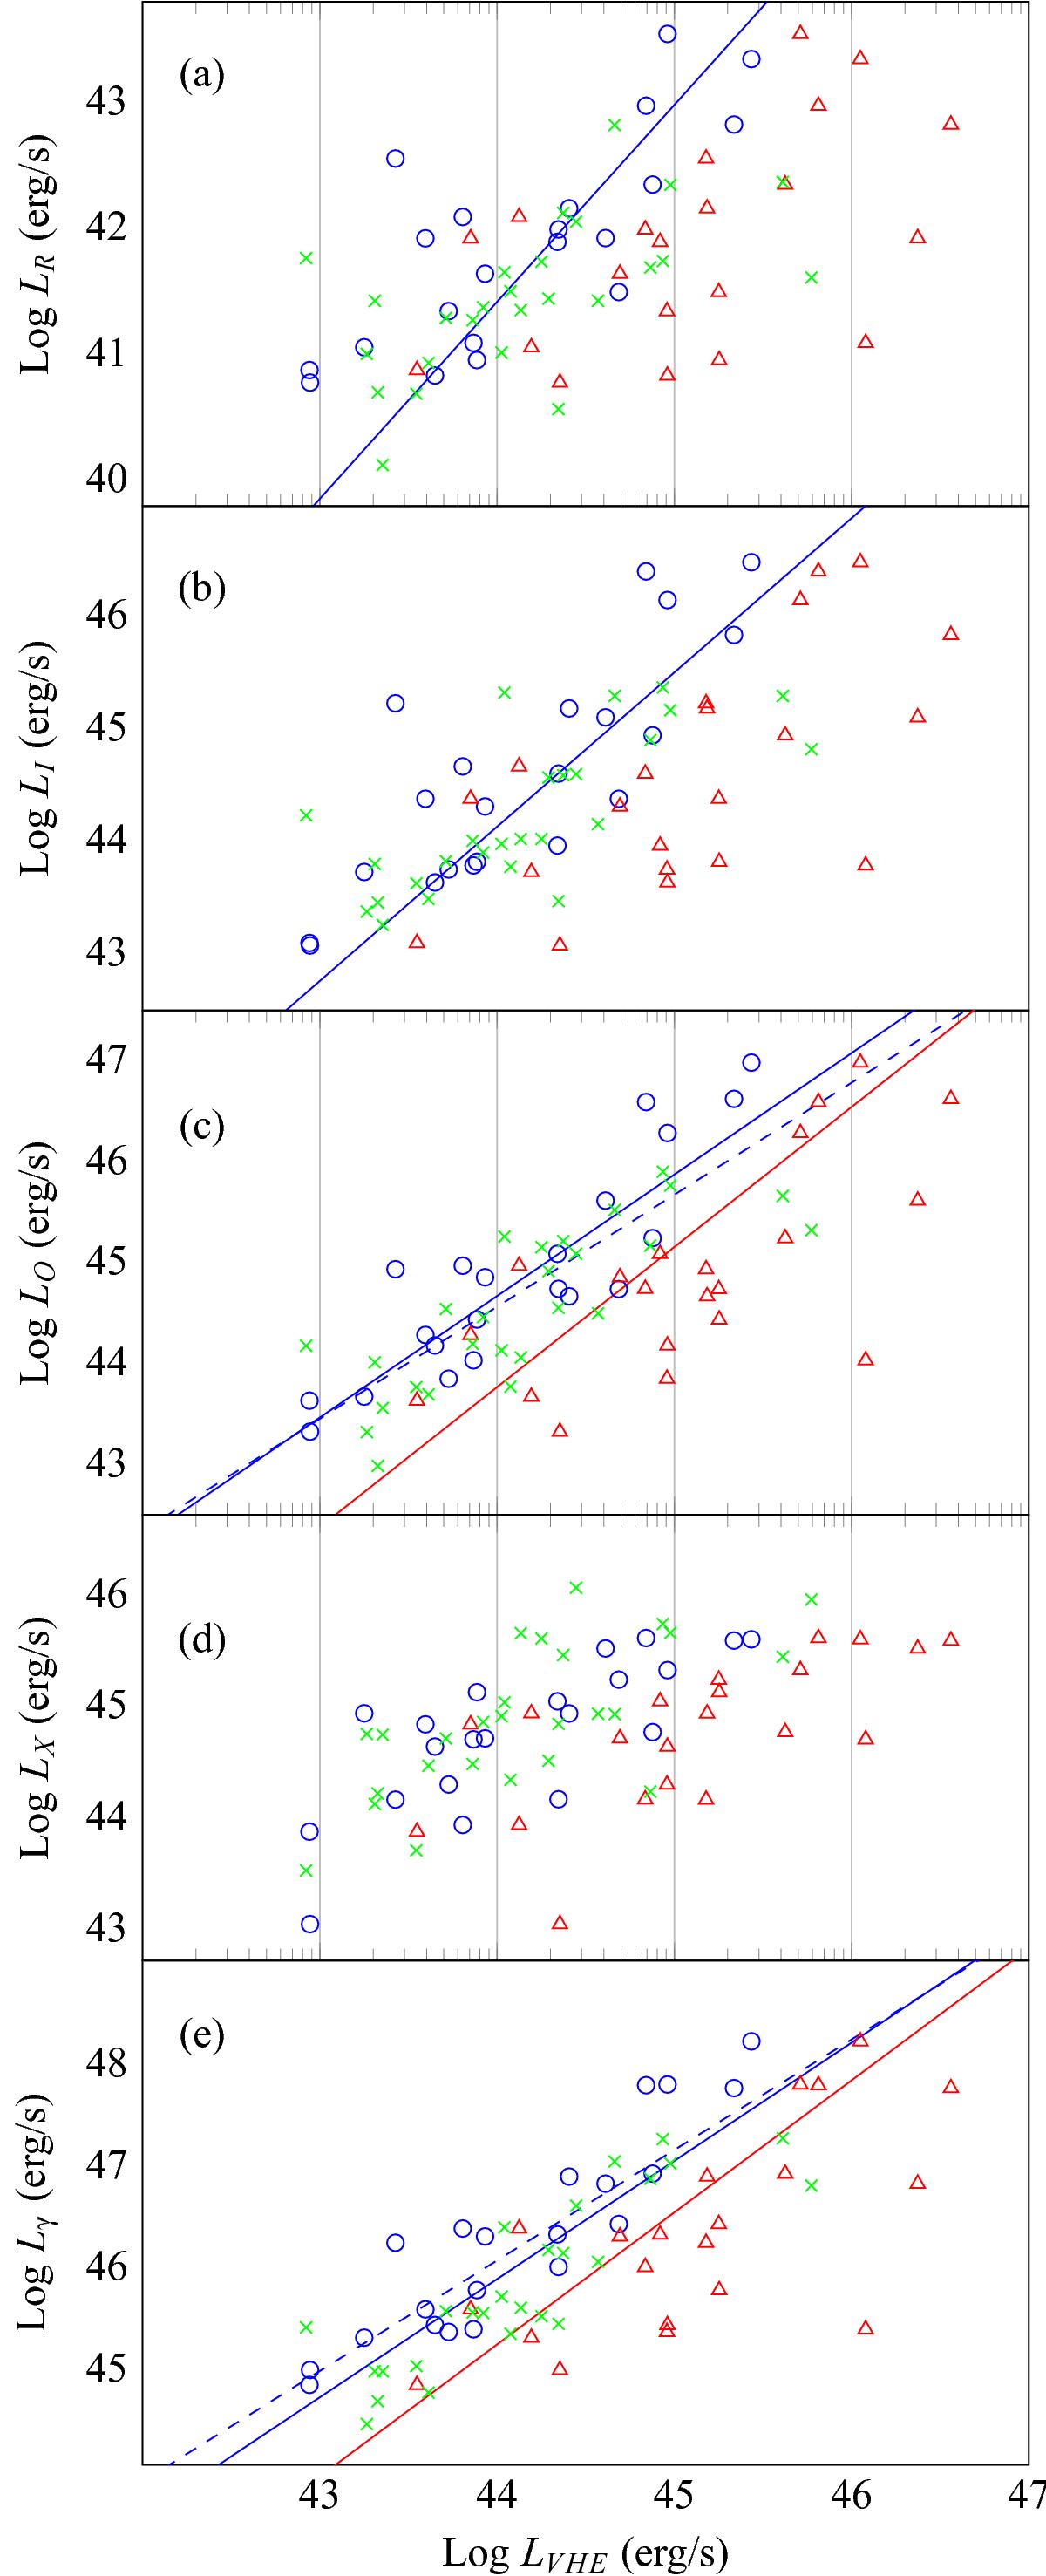
Luminosity in the VHE γ-ray band vs. luminosity in radio (a), mid-infrared (b), optical (c), X-ray (d), and γ-ray (e) bands in logarithmic scale. The different symbols represent the data of different groups (see text): low state group A (circle), high state group A (triangle) and group B (greencross). The correlation functions of the various groups are shown with low state group A (blue dashed line), the combined dataset of high state group A and group B (red line), and the combined dataset of low state group A and group B (blue line).
Current usage metrics show cumulative count of Article Views (full-text article views including HTML views, PDF and ePub downloads, according to the available data) and Abstracts Views on Vision4Press platform.
Data correspond to usage on the plateform after 2015. The current usage metrics is available 48-96 hours after online publication and is updated daily on week days.
Initial download of the metrics may take a while.