Fig. 2
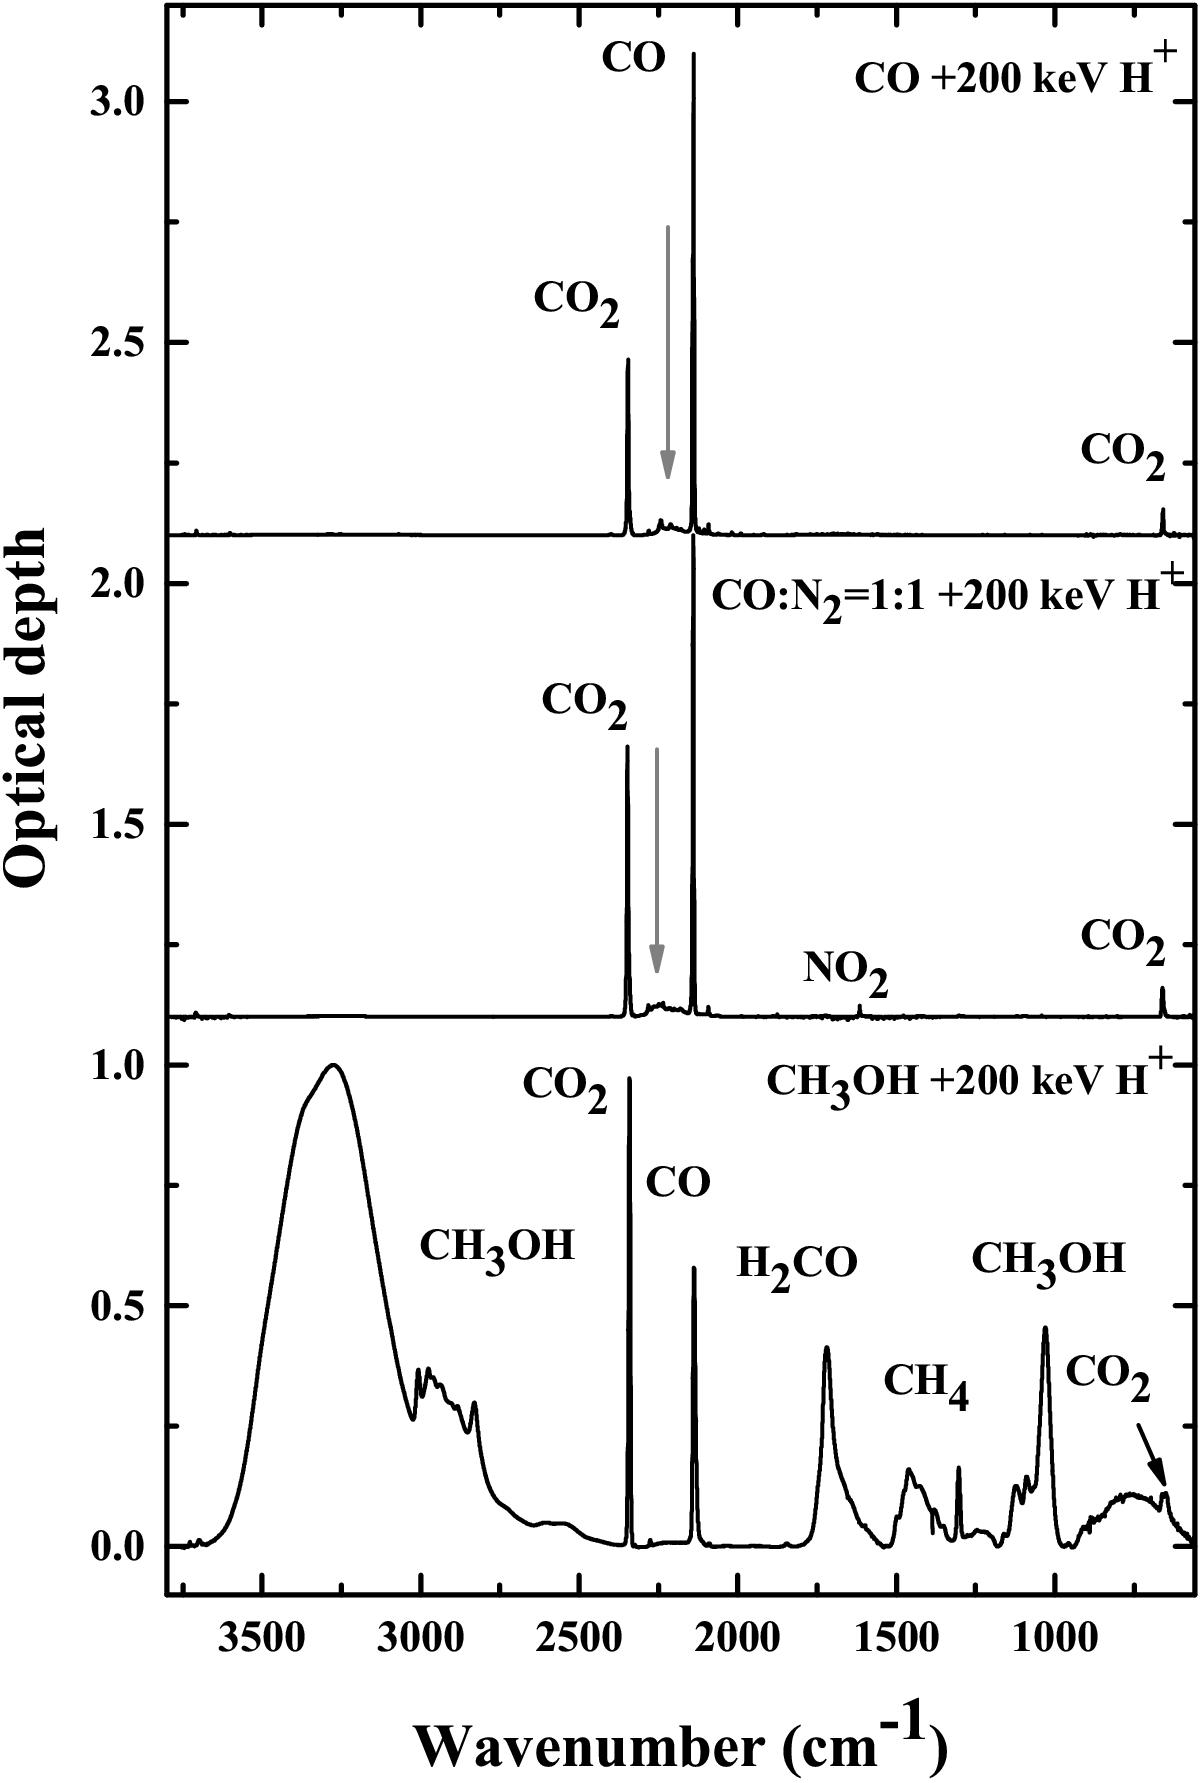
Selected infrared spectra, in the range 3800–560 cm-1, used in the fitting procedure. From top to bottom the spectra refer to pure CO after bombardment with 200 keV H+ at 16 K, a mixture CO:N2 = 1:1 after bombardment with 200 keV H+ at 16 K, and pure CH3OH after bombardment with 200 keV H+ at 16 K. Spectra are normalized to their maximum optical depth value and are shifted for clarity. The main features formed after bombardment are labelled. The vertical grey arrows indicate the spectral range where most of the features assigned to carbon chain oxides and nitrogen oxides occur. A detailed description of these spectra is given by Palumbo et al. (2008), Sicilia et al. (2012), and Modica & Palumbo (2010).
Current usage metrics show cumulative count of Article Views (full-text article views including HTML views, PDF and ePub downloads, according to the available data) and Abstracts Views on Vision4Press platform.
Data correspond to usage on the plateform after 2015. The current usage metrics is available 48-96 hours after online publication and is updated daily on week days.
Initial download of the metrics may take a while.