Fig. 6
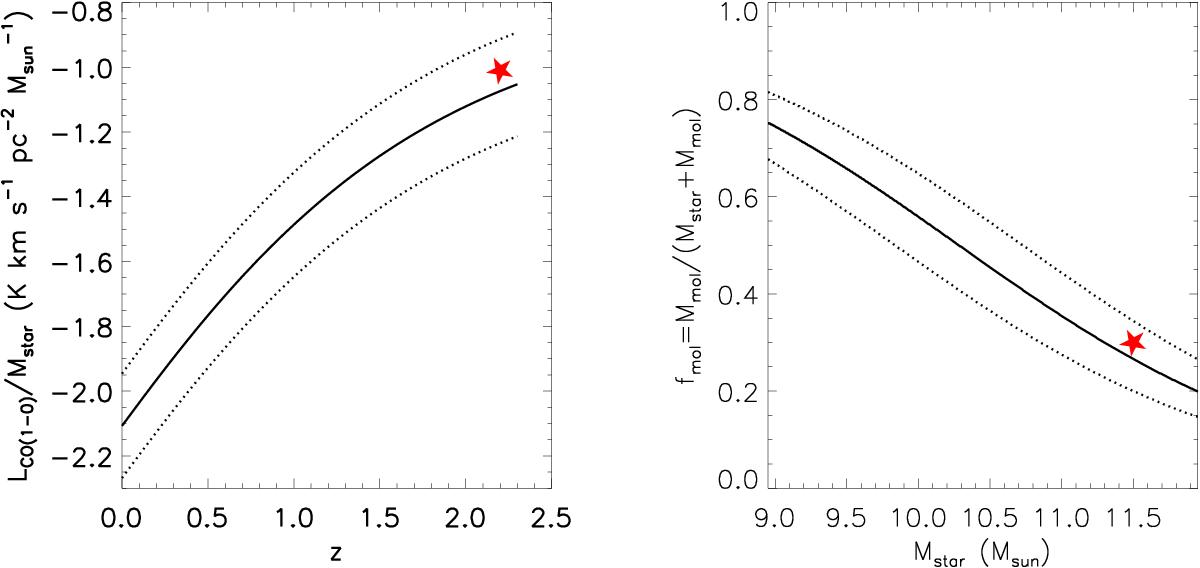
Left panel: ratio of the CO emission and stellar mass in units of K km s-1 pc![]() versus redshift. The solid and dotted line shows the median and 1σ dispersion of this ratio for main-sequence galaxies with a mass of 5 × 10¹¹ M⊙. The mass we have chosen for this comparison is approximately the stellar mass of HAE229. Right panel: molecular gas fractions and ±1σ dispersion (solid and dotted lines respectively) for main sequence galaxies at z = 2.2. The lines shown in both panels are from models discussed in Sargent et al. (2014) to explain the evolution of the main sequence of galaxies. The red star represents the estimated position of HAE229 in both panels.
versus redshift. The solid and dotted line shows the median and 1σ dispersion of this ratio for main-sequence galaxies with a mass of 5 × 10¹¹ M⊙. The mass we have chosen for this comparison is approximately the stellar mass of HAE229. Right panel: molecular gas fractions and ±1σ dispersion (solid and dotted lines respectively) for main sequence galaxies at z = 2.2. The lines shown in both panels are from models discussed in Sargent et al. (2014) to explain the evolution of the main sequence of galaxies. The red star represents the estimated position of HAE229 in both panels.
Current usage metrics show cumulative count of Article Views (full-text article views including HTML views, PDF and ePub downloads, according to the available data) and Abstracts Views on Vision4Press platform.
Data correspond to usage on the plateform after 2015. The current usage metrics is available 48-96 hours after online publication and is updated daily on week days.
Initial download of the metrics may take a while.