Fig. 4
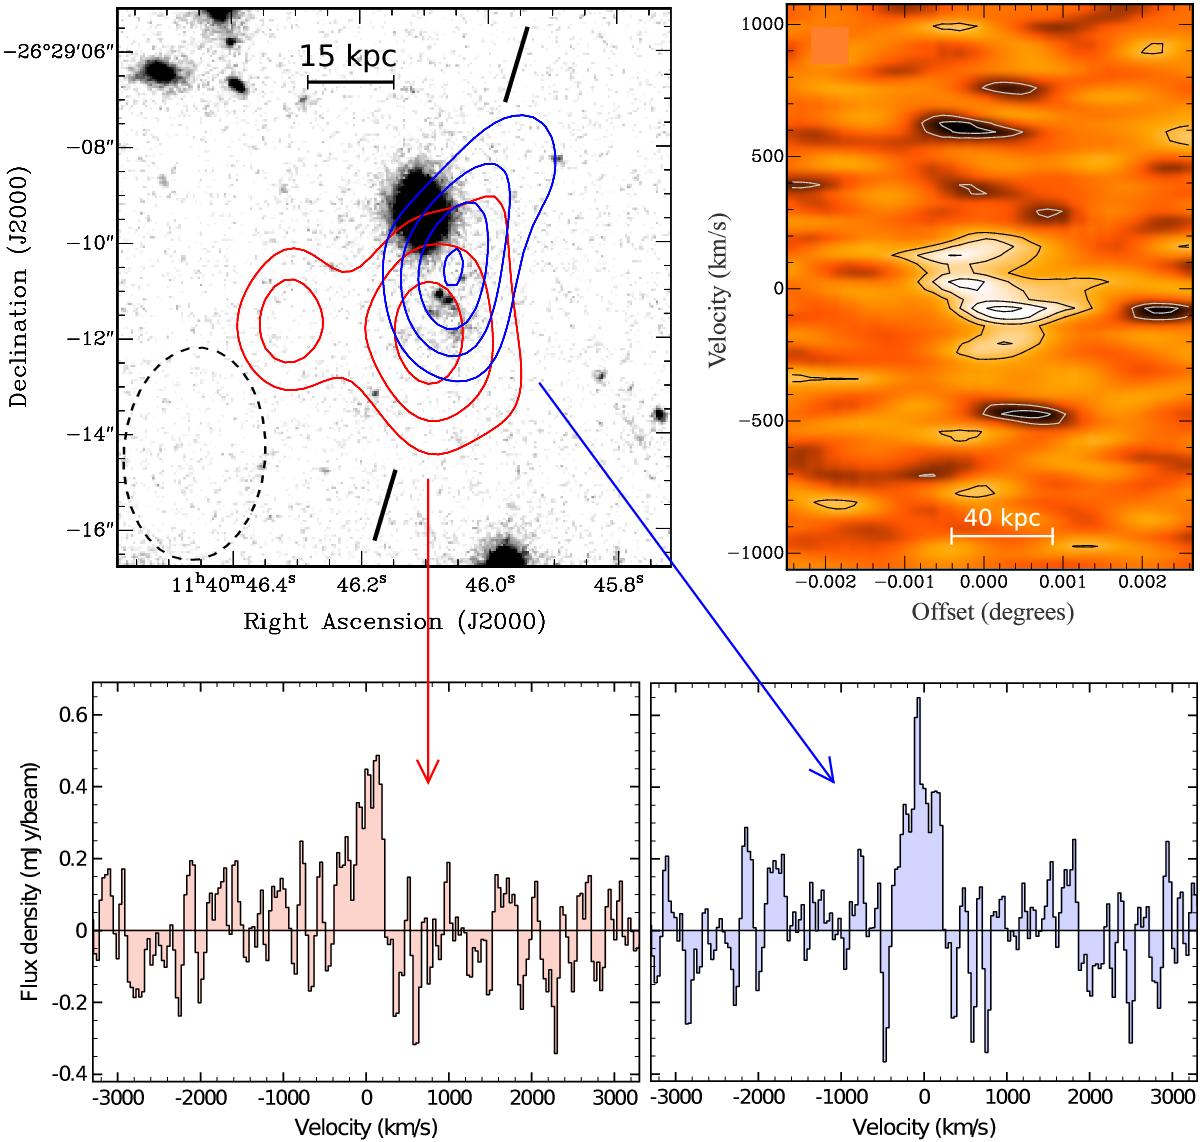
Overview of the CO(1–0) full-resolution ATCA data. Top left: total intensity image of the CO(1–0) emission across the velocity ranges −200 <v <0 km s-1 (blue contours) and 0 <v <+ 200 km s-1 (red contours). Contour levels are 3, 4, 5, 6σ, and σ = 0.015 Jy beam-1 km s-1. Following Papadopoulos et al. (2008), the relative accuracy in the position of the CO peak emission is ≲ 0.4′′. The dashed circle indicates the half-power size of the synthesized beam. Top right: position-velocity plot of the CO(1–0) emission along the line indicated in the top-left plot (along the northwestern-southeastern direction). Contours level shown are −4, −3, −2 (gray), 2, 3, 4, 5 (black) σ. Bottom: CO(1–0) spectra of the peak emission in the blue- and red-shifted velocity components as indicated in the plot at the top left. The spectra are not mutually independent due to the relatively large beam and due to having velocities that over-lap.
Current usage metrics show cumulative count of Article Views (full-text article views including HTML views, PDF and ePub downloads, according to the available data) and Abstracts Views on Vision4Press platform.
Data correspond to usage on the plateform after 2015. The current usage metrics is available 48-96 hours after online publication and is updated daily on week days.
Initial download of the metrics may take a while.