Free Access
Fig. 5
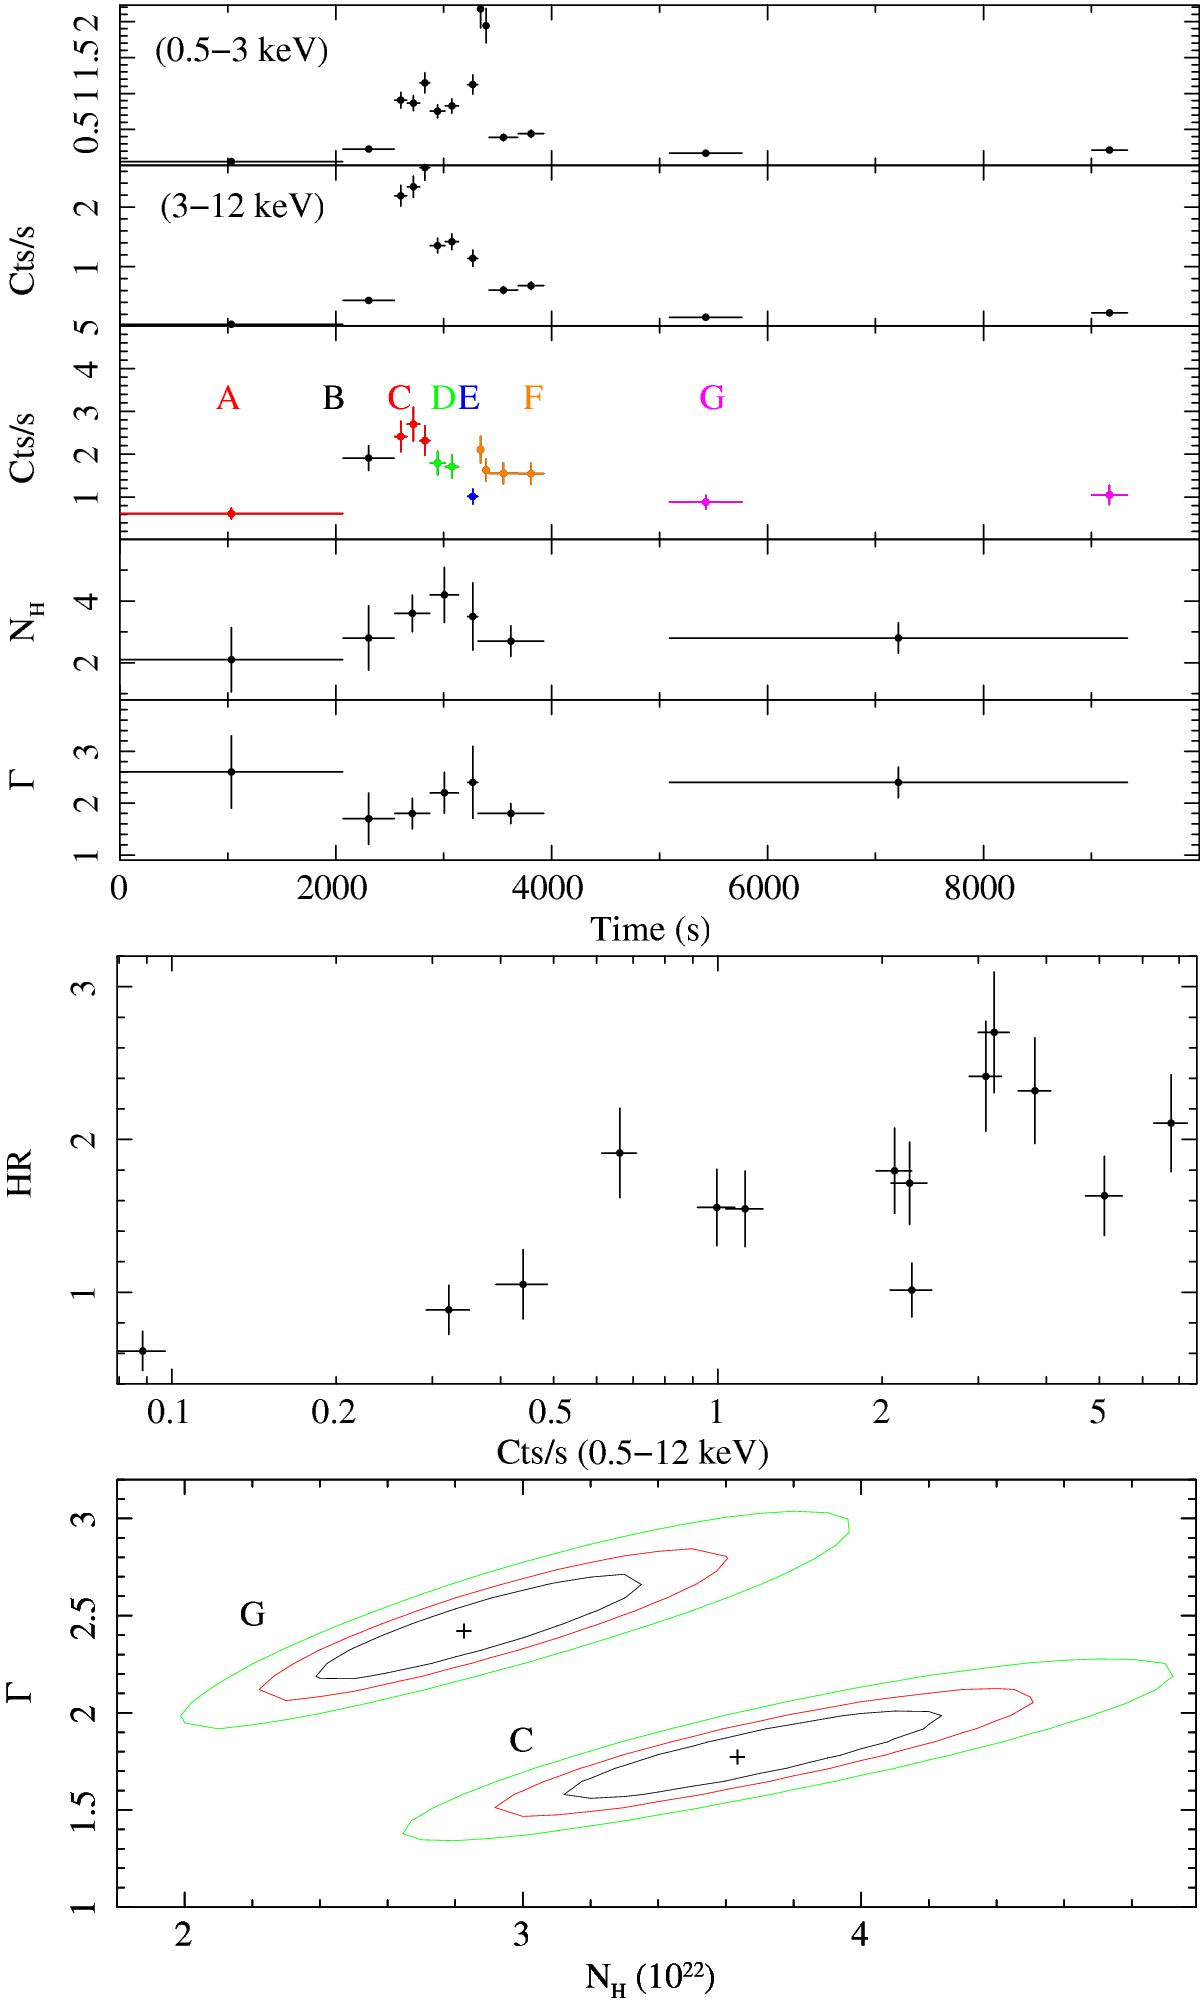
Same as Fig. 1, but for the case of IGR J17544-2619 observation 0148090501. An adaptive rebinning achieving S/N> 10 in each soft time bin was used to compute the HR and HID. The most relevant time intervals for the spectral variations are in this case “C” and “G”.
Current usage metrics show cumulative count of Article Views (full-text article views including HTML views, PDF and ePub downloads, according to the available data) and Abstracts Views on Vision4Press platform.
Data correspond to usage on the plateform after 2015. The current usage metrics is available 48-96 hours after online publication and is updated daily on week days.
Initial download of the metrics may take a while.