Fig. 15
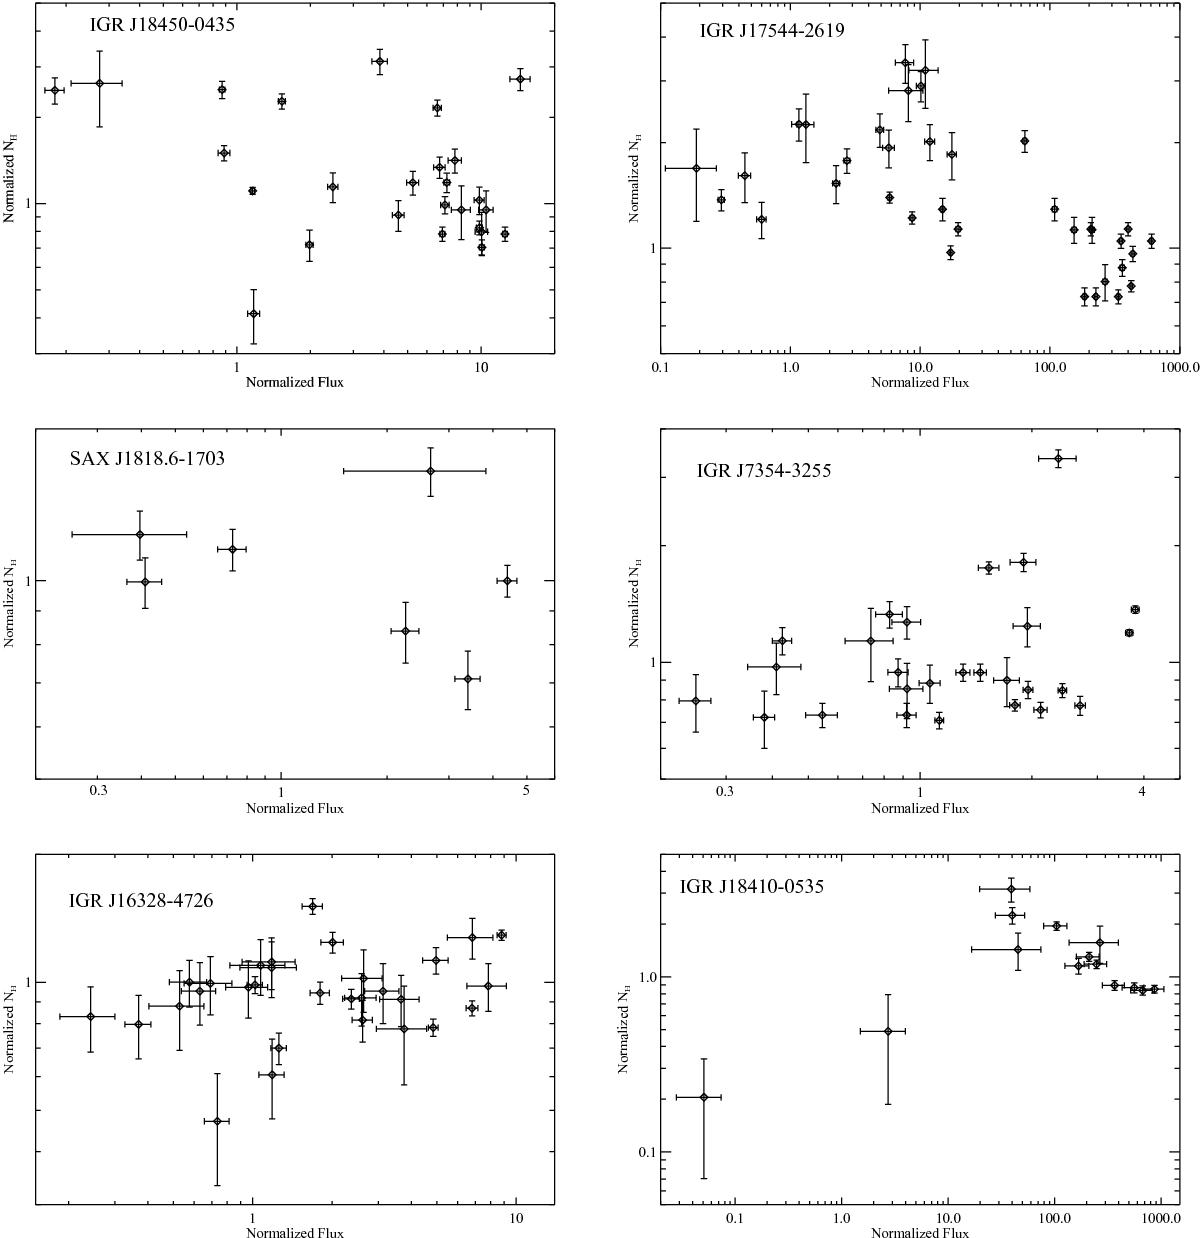
Distributions of the normalized absorption column density as a function of the normalized flux (1–10 keV) measured from the HR-resolved spectral analysis for the five sources in Sect. 2 (see text for further details). The previously published XMM-Newton data on the outburst of IGR J17544-2619 (Bozzo et al. 2016b) and the bright flare from IGR J18410-0535 (Bozzo et al. 2011) are also included. All uncertainties are at 1σ confidence level.
Current usage metrics show cumulative count of Article Views (full-text article views including HTML views, PDF and ePub downloads, according to the available data) and Abstracts Views on Vision4Press platform.
Data correspond to usage on the plateform after 2015. The current usage metrics is available 48-96 hours after online publication and is updated daily on week days.
Initial download of the metrics may take a while.