Fig. 1
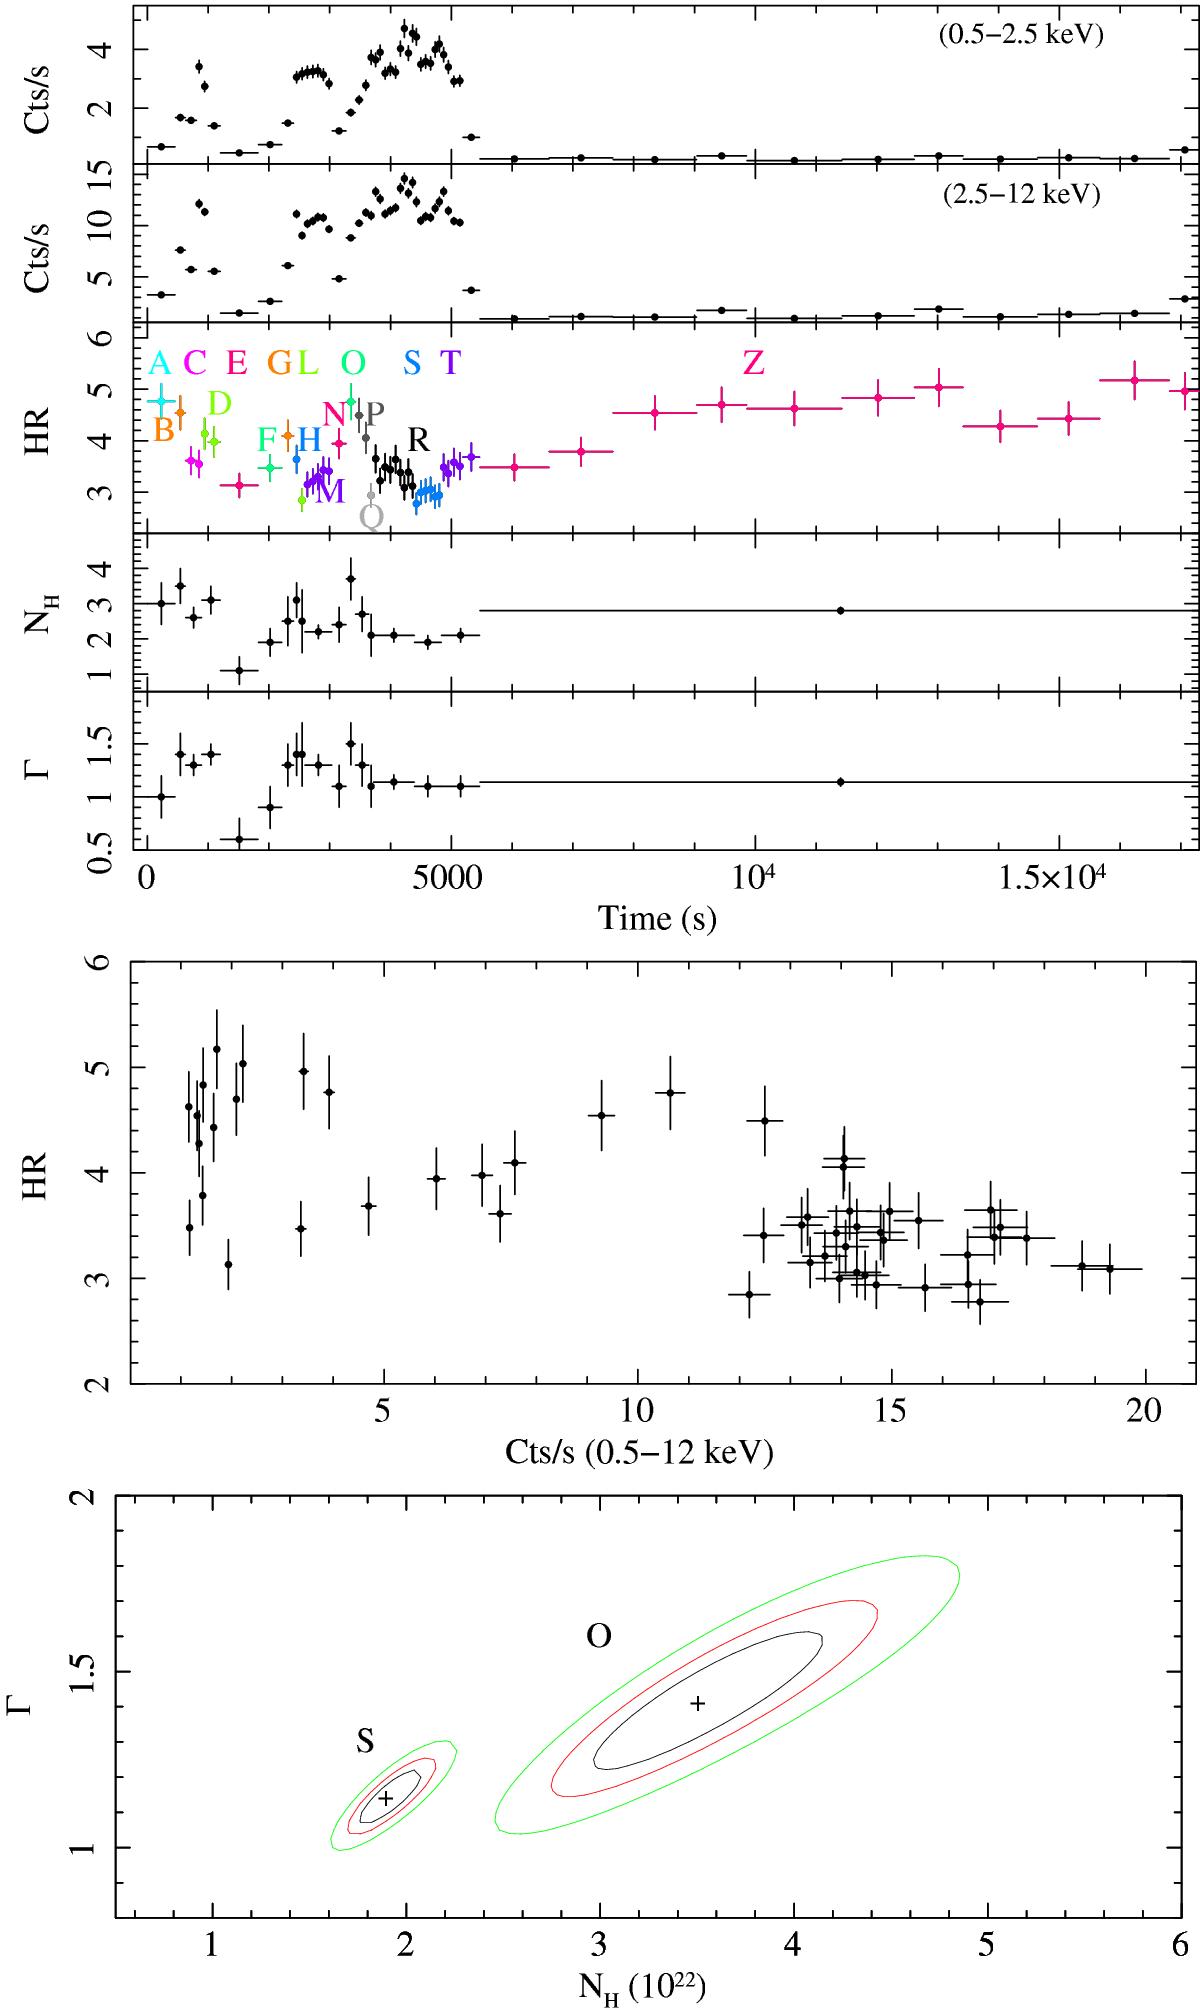
Results obtained from observation 0306170401 of IGR J18450-0435. Top: EPIC-pn light curve of the source in two energy bands and the corresponding HR (an adaptive rebinning was used to achieve a minimum S/N> 15 in each soft time bin). The letters in the middle panel indicate the different HR resolved spectra listed in Table A.1. The last two panels show the results obtained from the spectral fits to the HR-resolved spectral analysis (the measured absorption column density in units of 1022 cm-2 and the photon index Γ). Middle: hardness intensity diagram (HID). Bottom: contour plot showing the ranges spanned by the power-law photon index and the absorption column density measured from the most relevant time intervals for the spectral variations marked in the second plot from the top (in this case the intervals “O” and “S”).
Current usage metrics show cumulative count of Article Views (full-text article views including HTML views, PDF and ePub downloads, according to the available data) and Abstracts Views on Vision4Press platform.
Data correspond to usage on the plateform after 2015. The current usage metrics is available 48-96 hours after online publication and is updated daily on week days.
Initial download of the metrics may take a while.