Free Access
Fig. 5
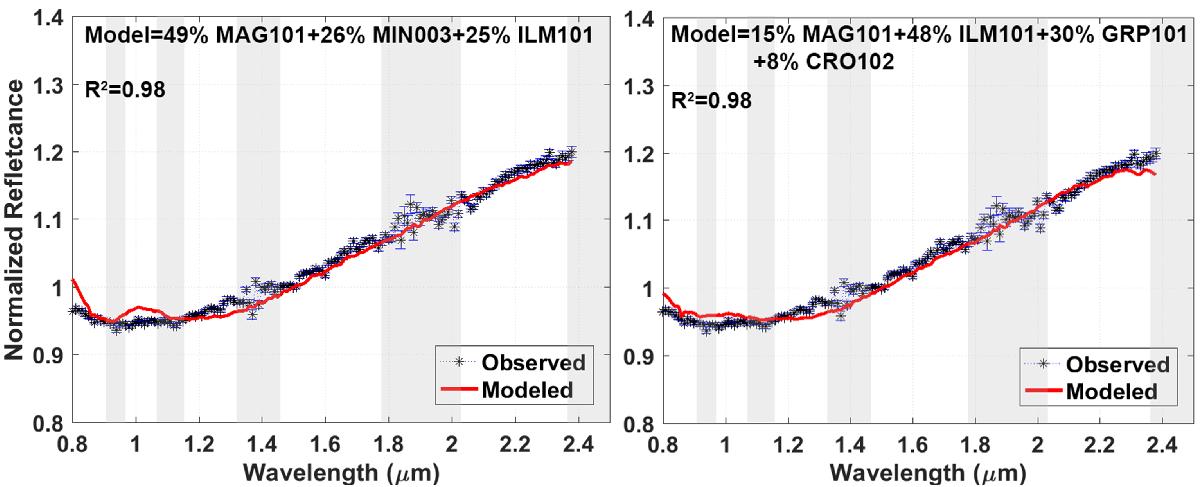
Results of linear unmixing applied to Himalia’s averaged spectrum using three (left) and four (right) end members. Out of ten runs, the best case with the lowest χ2 and maximum R2 is shown here. The grey bands indicate the location of the telluric bands.
Current usage metrics show cumulative count of Article Views (full-text article views including HTML views, PDF and ePub downloads, according to the available data) and Abstracts Views on Vision4Press platform.
Data correspond to usage on the plateform after 2015. The current usage metrics is available 48-96 hours after online publication and is updated daily on week days.
Initial download of the metrics may take a while.