Fig. 9
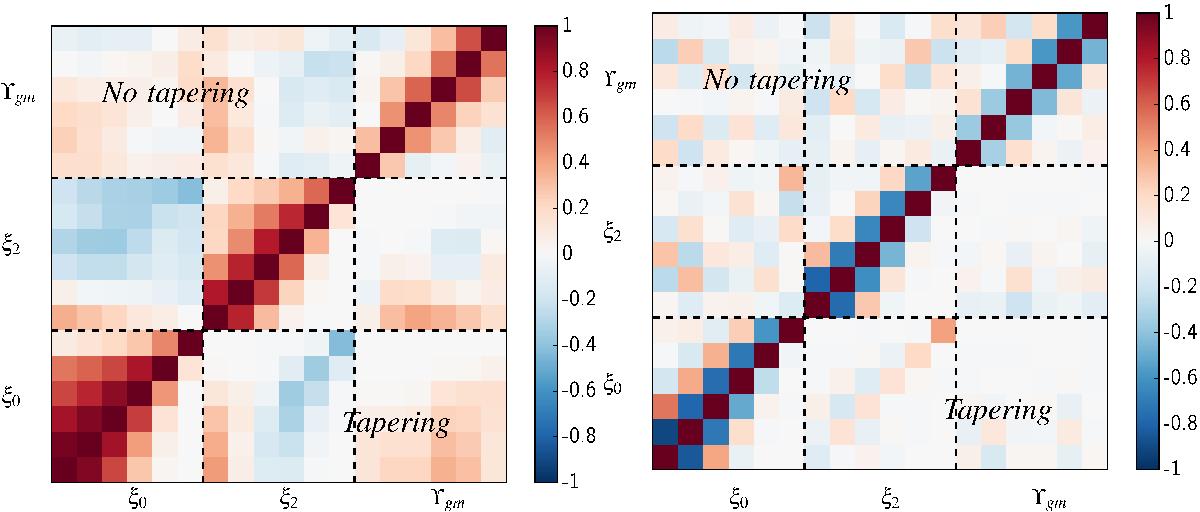
Correlation matrix (left panel) and normalized precision matrix (right panel) for galaxy clustering and galaxy-galaxy lensing data in the redshift interval 0.5 <z < 0.7. These are defined as Cij/![]() and
and ![]() /
/![]() respectively, where Cij and
respectively, where Cij and ![]() refer to covariance and precision matrix elements respectively. In both panels, the upper triangular matrix represents the case without tapering, while the lower panel the case with tapering. The precision matrix is normalized such that diagonal elements are unity.
refer to covariance and precision matrix elements respectively. In both panels, the upper triangular matrix represents the case without tapering, while the lower panel the case with tapering. The precision matrix is normalized such that diagonal elements are unity.
Current usage metrics show cumulative count of Article Views (full-text article views including HTML views, PDF and ePub downloads, according to the available data) and Abstracts Views on Vision4Press platform.
Data correspond to usage on the plateform after 2015. The current usage metrics is available 48-96 hours after online publication and is updated daily on week days.
Initial download of the metrics may take a while.