Fig. 8
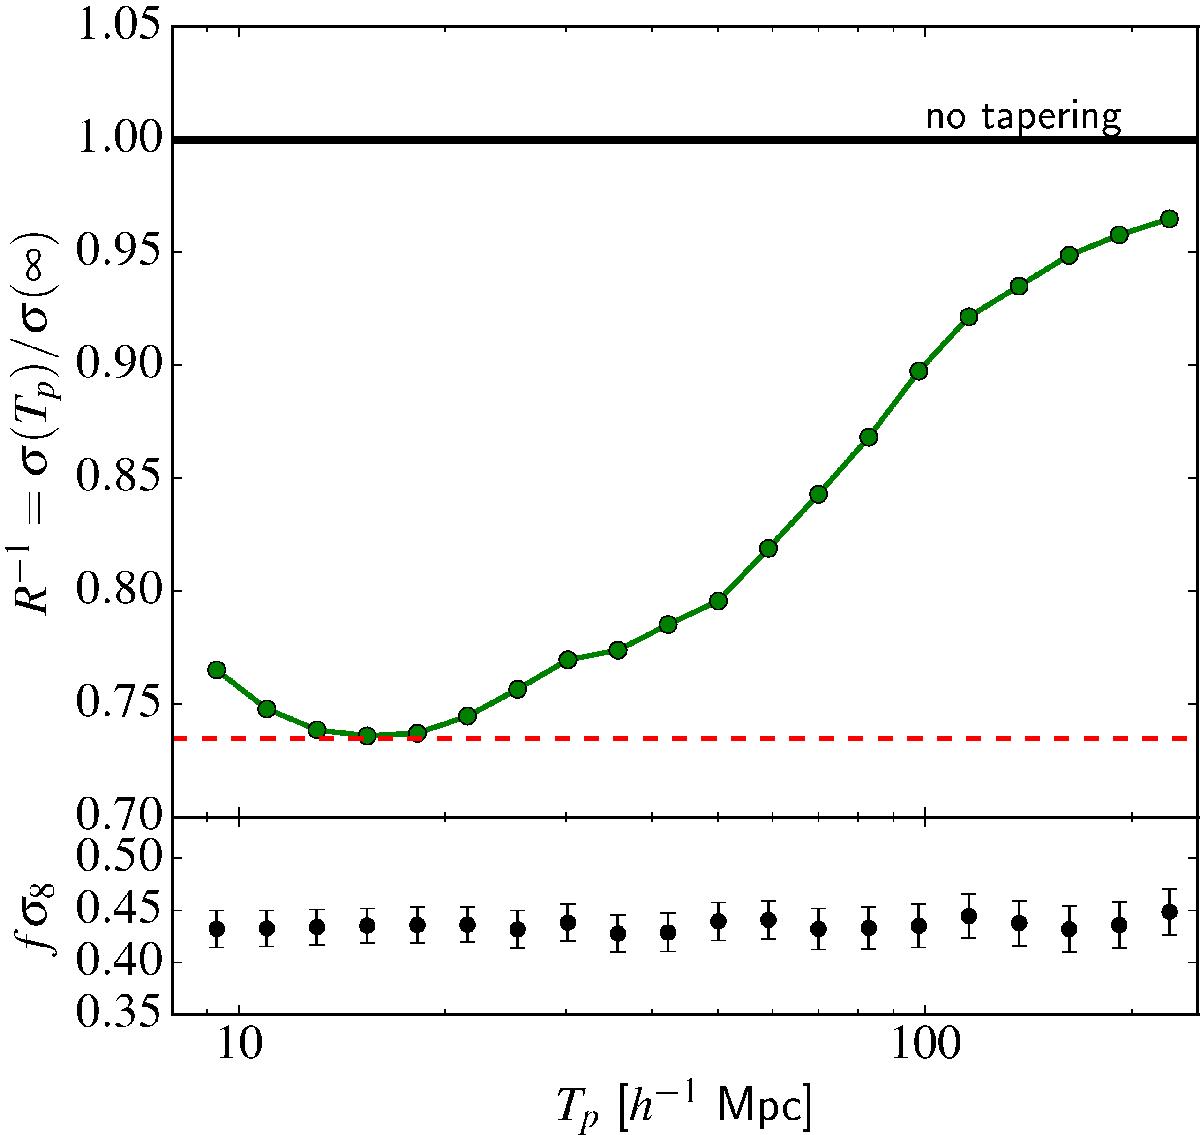
Top panel: recovered errors on fσ8 normalized to that obtained without tapering (equivalent to applying tapering with Tp = ∞), as a function of the tapering scale Tp used in the estimation of the precision matrix. This is obtained from the mocks at 0.5 <z < 0.7. Bottom panel: recovered maximum likelihood values for fσ8 and associated 1σ error as a function of the tapering scale Tp.
Current usage metrics show cumulative count of Article Views (full-text article views including HTML views, PDF and ePub downloads, according to the available data) and Abstracts Views on Vision4Press platform.
Data correspond to usage on the plateform after 2015. The current usage metrics is available 48-96 hours after online publication and is updated daily on week days.
Initial download of the metrics may take a while.