Fig. 4
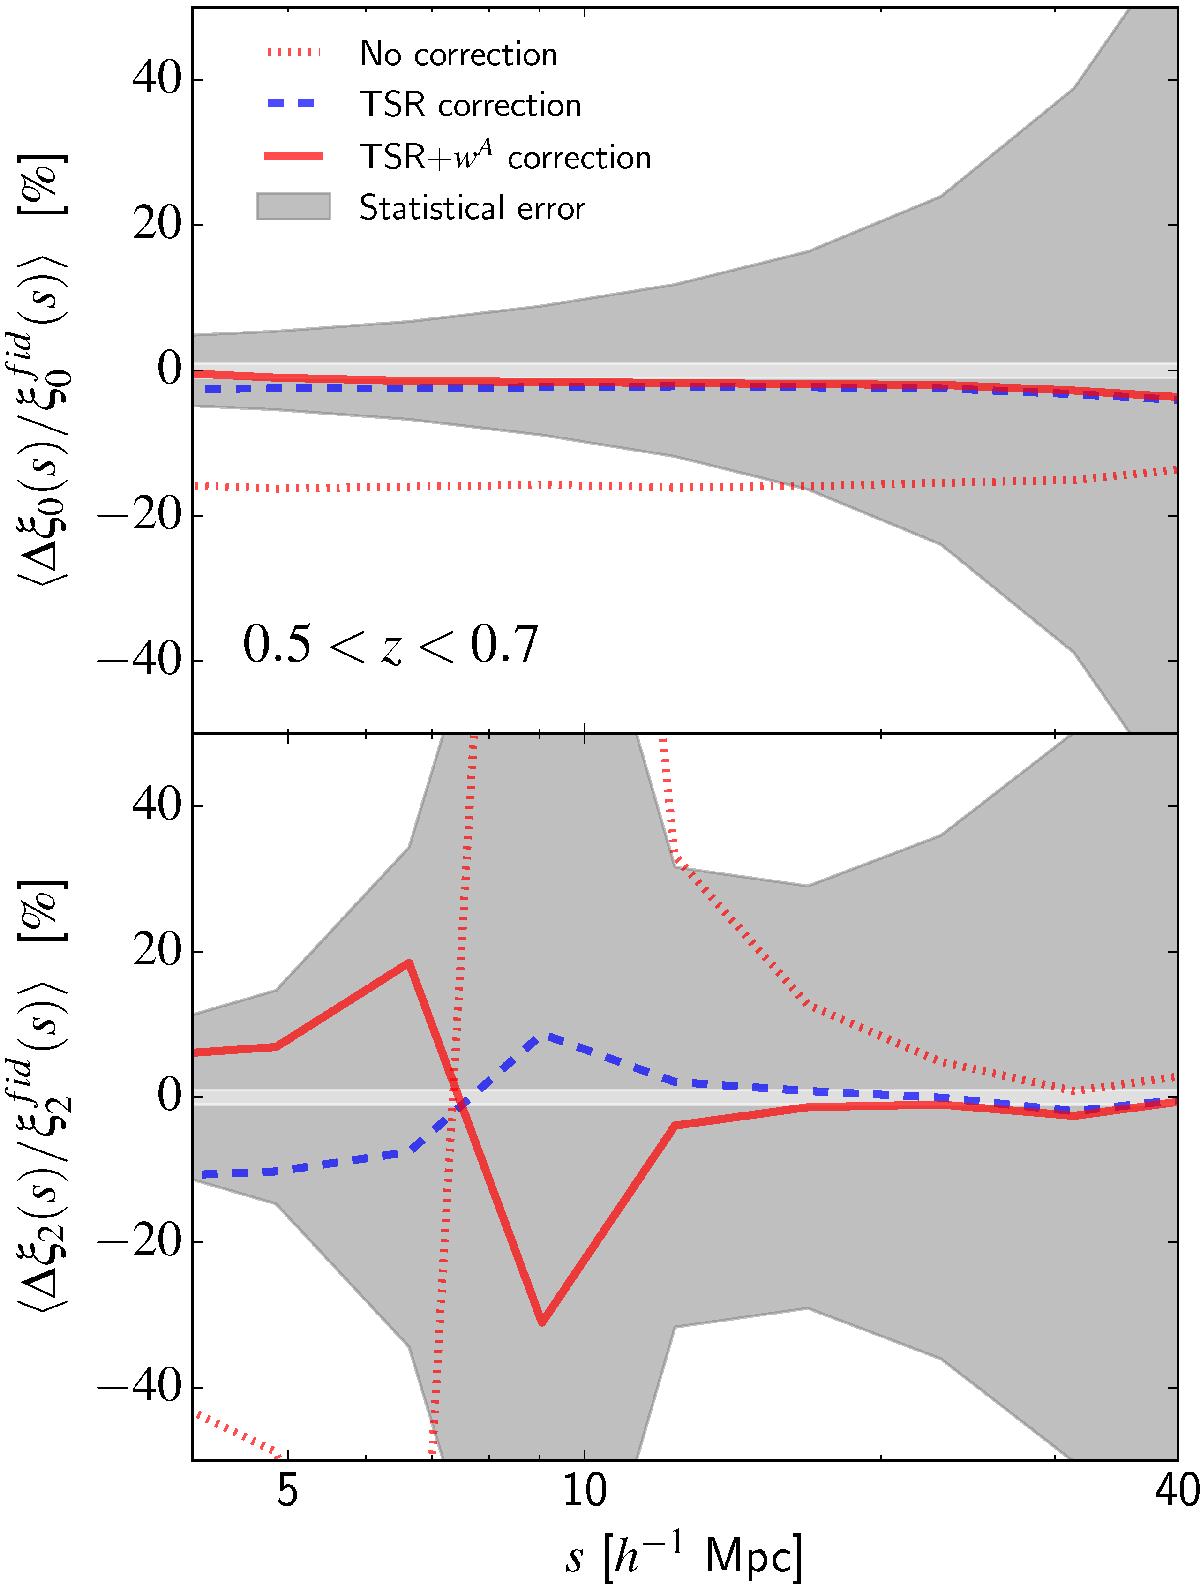
Relative systematic errors on the correlation function monopole (top panel) and quadrupole (bottom panel) at 0.5 <z < 0.7 and effects of target sampling rate (TSR) and angular pair weighting (wA) corrections. The grey shaded areas represent the relative statistical error expected in the survey, while light grey band mark ± 1% relative uncertainties for reference.
Current usage metrics show cumulative count of Article Views (full-text article views including HTML views, PDF and ePub downloads, according to the available data) and Abstracts Views on Vision4Press platform.
Data correspond to usage on the plateform after 2015. The current usage metrics is available 48-96 hours after online publication and is updated daily on week days.
Initial download of the metrics may take a while.