Fig. 17
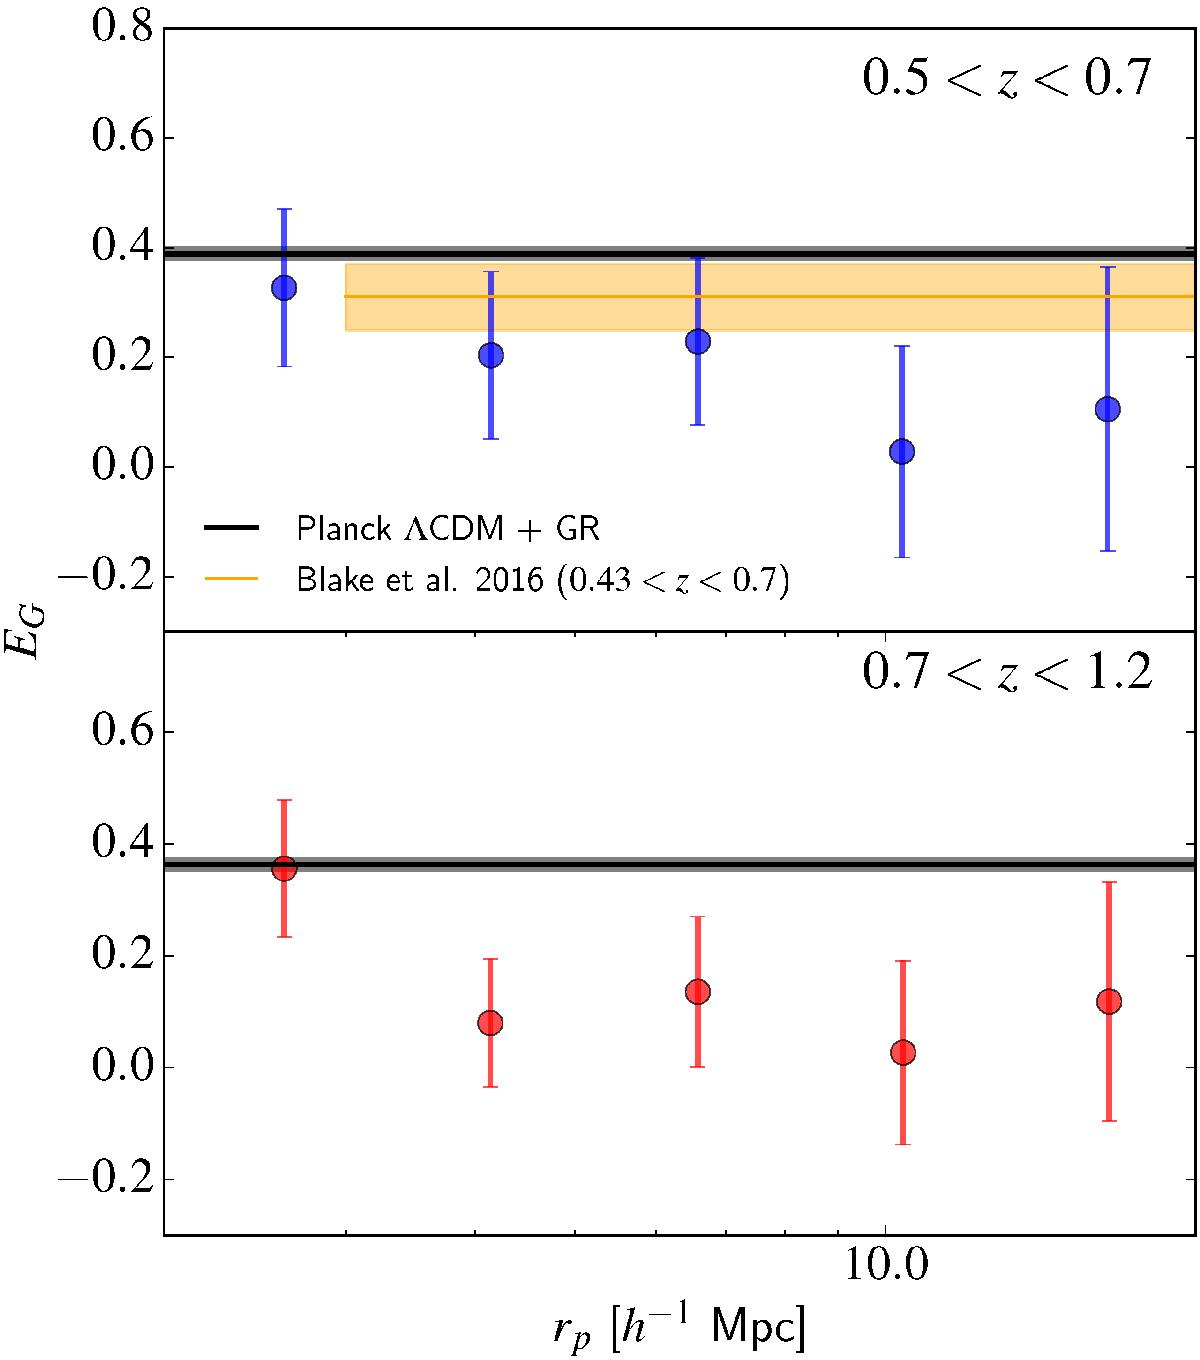
Gravitational slip parameter as a function of scale as measured at 0.5 <z < 0.7 (top panel) and 0.7 <z < 1.2 (bottom panel). In both panels, the solid curves and associated shaded areas correspond to the expectations and 68% uncertainties for General Relativity in a ΛCDM background model set to TT+lowP+lensing Planck 2015 predictions (Planck Collaboration XIII 2016). In the top panel, the horizontal stripe shows the averaged ![]() over the range 3 h-1 Mpc <rp < 50 h-1 Mpc obtained by Blake et al. (2016) at 0.43 <z < 0.7. EG asymptotes to Ωm/f in the standard model, and the simplest way of erasing the modest discrepancy with the model prediction would be to lower the density parameter.
over the range 3 h-1 Mpc <rp < 50 h-1 Mpc obtained by Blake et al. (2016) at 0.43 <z < 0.7. EG asymptotes to Ωm/f in the standard model, and the simplest way of erasing the modest discrepancy with the model prediction would be to lower the density parameter.
Current usage metrics show cumulative count of Article Views (full-text article views including HTML views, PDF and ePub downloads, according to the available data) and Abstracts Views on Vision4Press platform.
Data correspond to usage on the plateform after 2015. The current usage metrics is available 48-96 hours after online publication and is updated daily on week days.
Initial download of the metrics may take a while.