Fig. 1
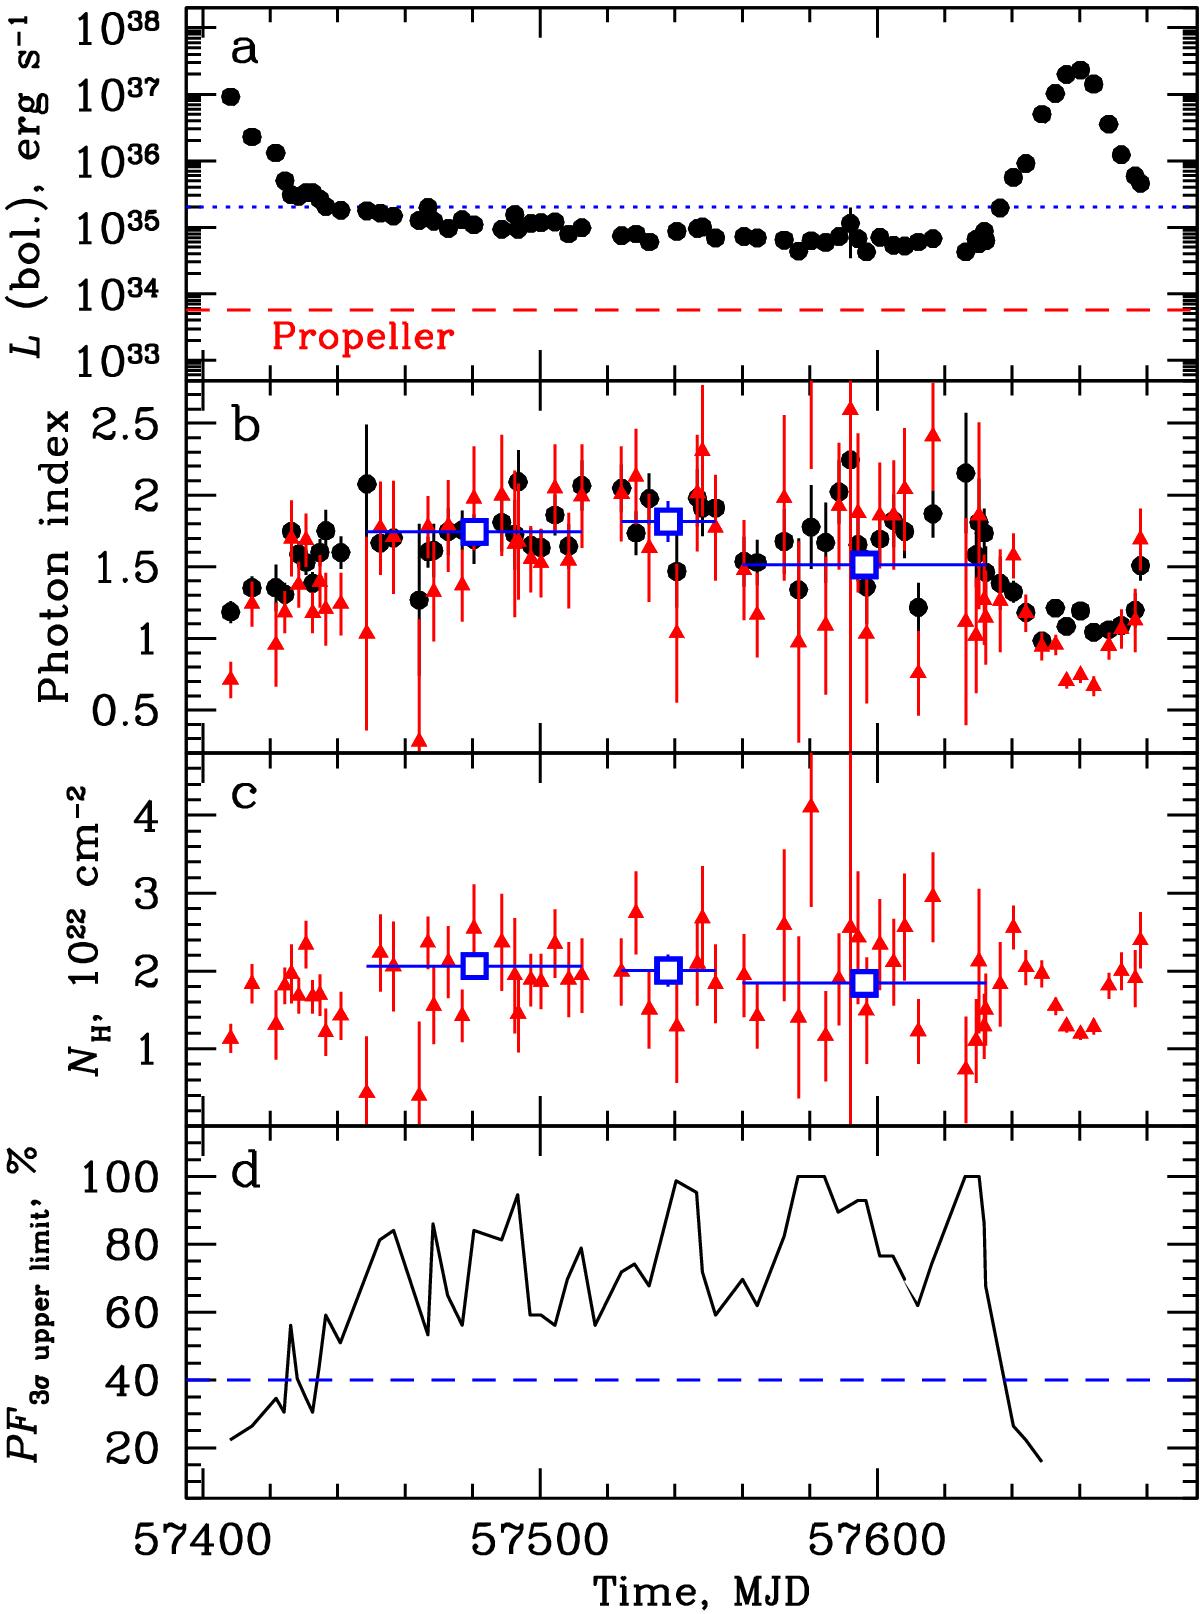
Panel a: Bolometric luminosity of GRO J1008−57 obtained by the Swift/XRT telescope. The luminosity is calculated from the unabsorbed flux assuming a distance d = 5.8 kpc and fixed NH = 2.0 × 1022 cm-2. The dashed red and dotted blue lines show the predicted luminosity Lprop for the transition to the propeller regime and the observed transition to the low-level stable accretion regime, respectively. Panels b and c represent variations of the photon index and absorption value with time, respectively. Black symbols correspond to the fixed NH, red triangles and blue open squares to the absorption as a free parameter. In panel d the estimated 3σ upper limits for the pulsed fraction as function of time are shown for the Swift/XRT data with the horizontal dashed line showing the typical pulsed fraction measured during the bright state. The pulsations are clearly detected in all observations, which are expected to be sufficiently sensitive (i.e. below this line), but not elsewhere.
Current usage metrics show cumulative count of Article Views (full-text article views including HTML views, PDF and ePub downloads, according to the available data) and Abstracts Views on Vision4Press platform.
Data correspond to usage on the plateform after 2015. The current usage metrics is available 48-96 hours after online publication and is updated daily on week days.
Initial download of the metrics may take a while.