Fig. 8
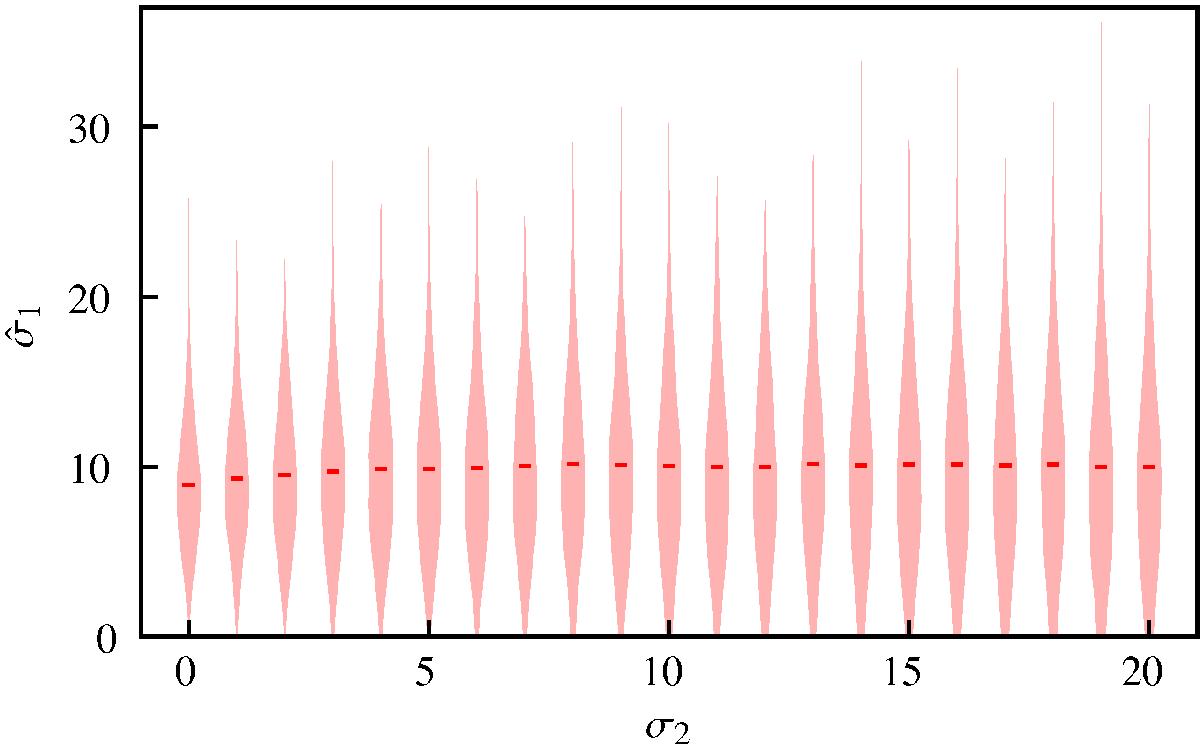
Violin plot showing the distribution of measured densities ![]() for σ1 = 10 and σ2 ∈ [0,20]. Each elongated structure corresponds to a different value of σ2; its width is proportional to the distribution of measured values of
for σ1 = 10 and σ2 ∈ [0,20]. Each elongated structure corresponds to a different value of σ2; its width is proportional to the distribution of measured values of ![]() , i.e. effectively it is a histogram displayed vertically. The small red dashes indicate the average values.
, i.e. effectively it is a histogram displayed vertically. The small red dashes indicate the average values.
Current usage metrics show cumulative count of Article Views (full-text article views including HTML views, PDF and ePub downloads, according to the available data) and Abstracts Views on Vision4Press platform.
Data correspond to usage on the plateform after 2015. The current usage metrics is available 48-96 hours after online publication and is updated daily on week days.
Initial download of the metrics may take a while.