Fig. 3
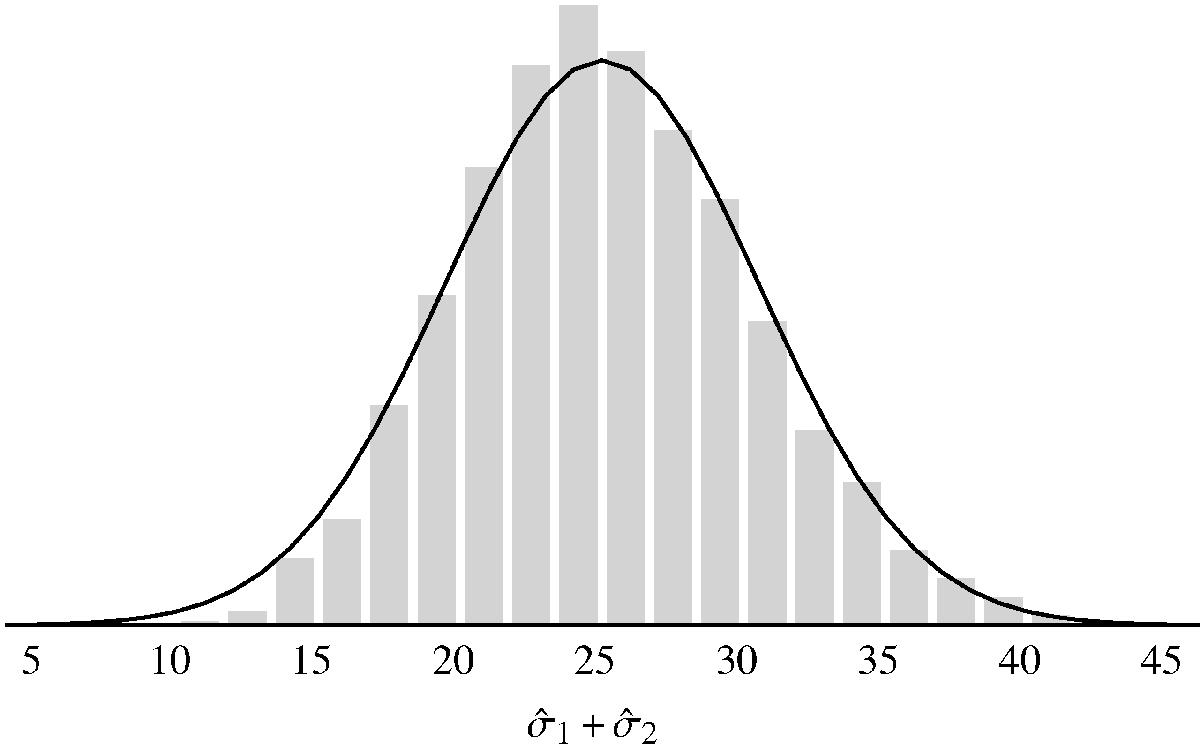
Distribution of measured total density ![]() in a simulation with σ1 = 5 and σ2 = 20, together with the predicted Gaussian distribution (derived from the Fisher matrix). The distribution is essentially unbiased; moreover, because of the anticorrelation between
in a simulation with σ1 = 5 and σ2 = 20, together with the predicted Gaussian distribution (derived from the Fisher matrix). The distribution is essentially unbiased; moreover, because of the anticorrelation between ![]() and
and ![]() , the total density has significantly less scatter than both
, the total density has significantly less scatter than both ![]() and
and ![]() .
.
Current usage metrics show cumulative count of Article Views (full-text article views including HTML views, PDF and ePub downloads, according to the available data) and Abstracts Views on Vision4Press platform.
Data correspond to usage on the plateform after 2015. The current usage metrics is available 48-96 hours after online publication and is updated daily on week days.
Initial download of the metrics may take a while.