Free Access
Fig. 2
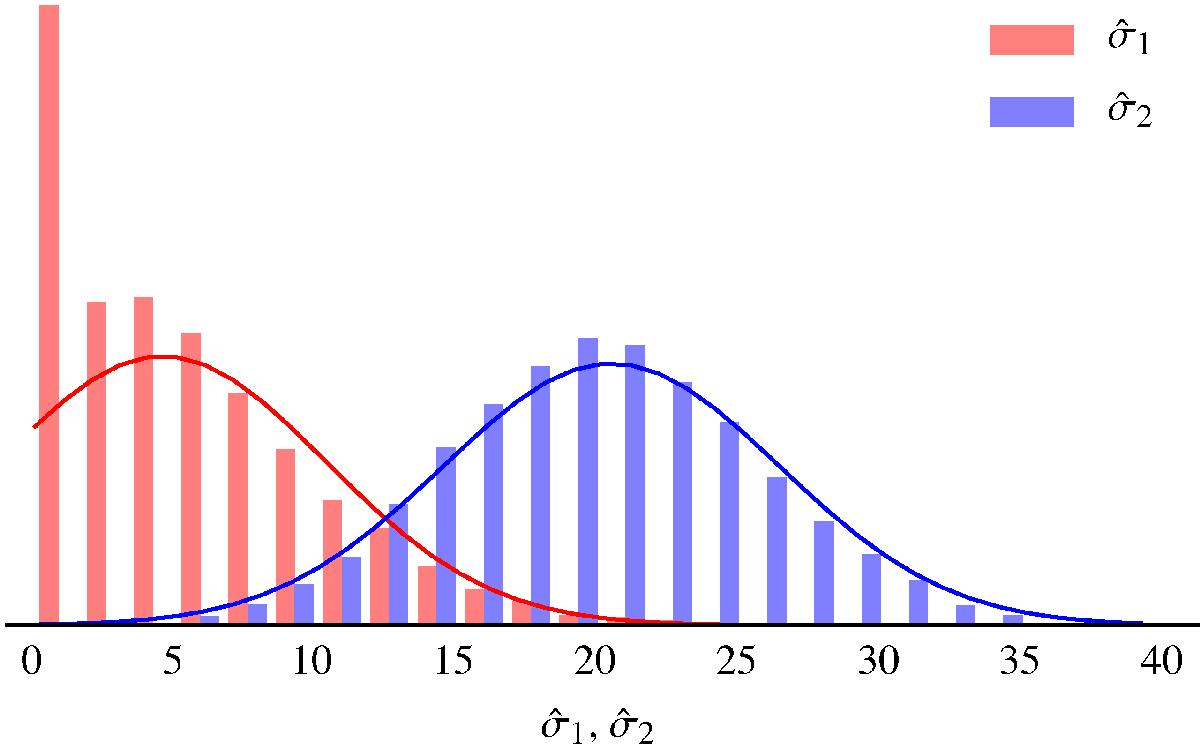
Distributions of measured densities in a simulation with σ1 = 5 and σ2 = 20 (histogram), together with the predicted Gaussian distribution obtained according to the Fisher matrix evaluated from Eq. (31). The excess of small values of ![]() is due to the constraint that
is due to the constraint that ![]() imposed by the algorithm.
imposed by the algorithm.
Current usage metrics show cumulative count of Article Views (full-text article views including HTML views, PDF and ePub downloads, according to the available data) and Abstracts Views on Vision4Press platform.
Data correspond to usage on the plateform after 2015. The current usage metrics is available 48-96 hours after online publication and is updated daily on week days.
Initial download of the metrics may take a while.