Fig. 7
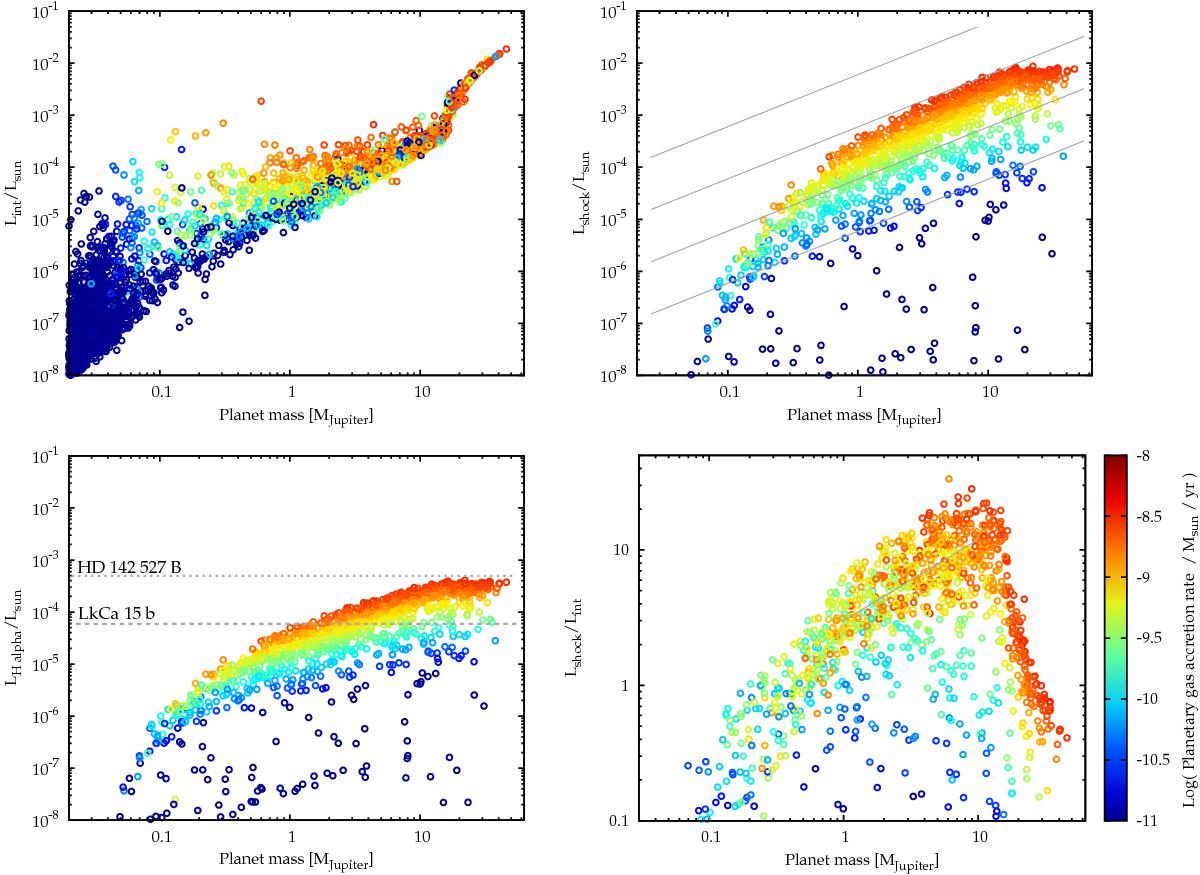
The separate contributions to the luminosity of giant planets during the formation phase for the cold nominal accretion case. The internal luminosity Lint (top left) and the gas accretion shock luminosity Lshock (top right) is shown as a function of planetary mass for the population at 3 Myr. The bottom left panel shows the Hα luminosity obtained using the empirical Lshock−LHα relation from Rigliaco et al. (2012) derived for T Tauri stars. We stress that the validity of this relation in the planetary mass range is currently unknown. The observed LHα of HD 142527 b (Close et al. 2014) and LkCa 15 b (Sallum et al. 2015) are also shown for comparison. The bottom right panel shows the ratio of the accretion to the internal luminosity. The colors represent the planets’ gas accretion rate. The solid gray lines in the top right panel show Lshock as a function of mass for a fixed radius of 1.5 R♃ and accretion rates of 10-5, 10-4, 10-3, and 10-2M⊕/yr. The gray line in the bottom right panel shows a M0.5 scaling.
Current usage metrics show cumulative count of Article Views (full-text article views including HTML views, PDF and ePub downloads, according to the available data) and Abstracts Views on Vision4Press platform.
Data correspond to usage on the plateform after 2015. The current usage metrics is available 48-96 hours after online publication and is updated daily on week days.
Initial download of the metrics may take a while.