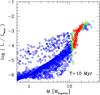
Fig. 5
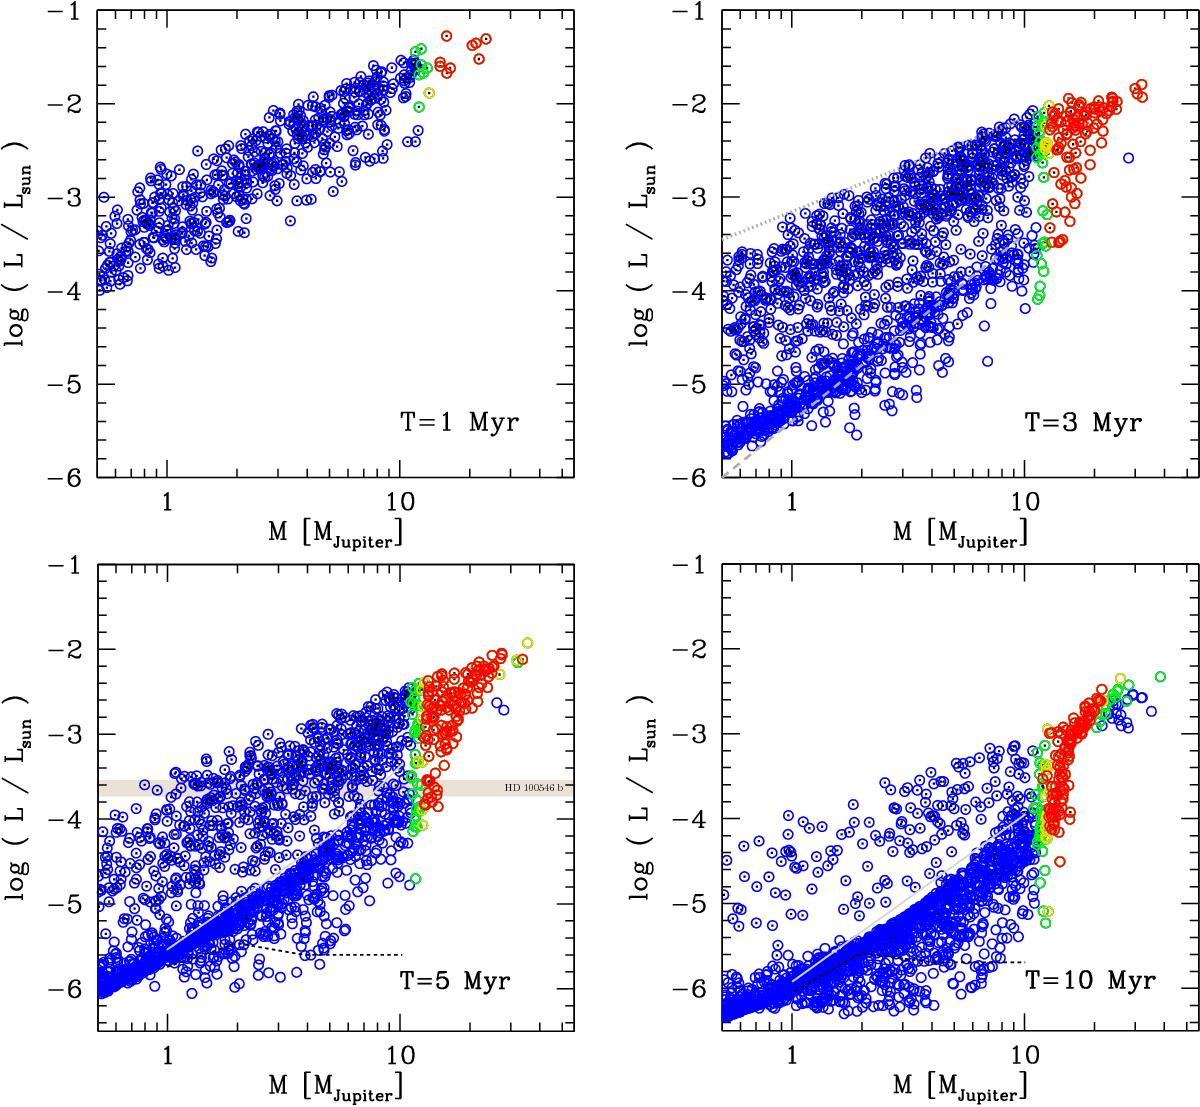
The mass-luminosity relation during the formation phase for the cold-classical (low core mass) population, analogous to Fig. 2. The gray and black lines in all four panels are identical as in Fig. 2. Note the giant planets with very low post-formation luminosities, even lower than in the classical cold start simulations of Marley et al. (2007) which are shown with the dotted black lines at 5 and 10 Myr.
Current usage metrics show cumulative count of Article Views (full-text article views including HTML views, PDF and ePub downloads, according to the available data) and Abstracts Views on Vision4Press platform.
Data correspond to usage on the plateform after 2015. The current usage metrics is available 48-96 hours after online publication and is updated daily on week days.
Initial download of the metrics may take a while.