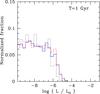
Fig. 17
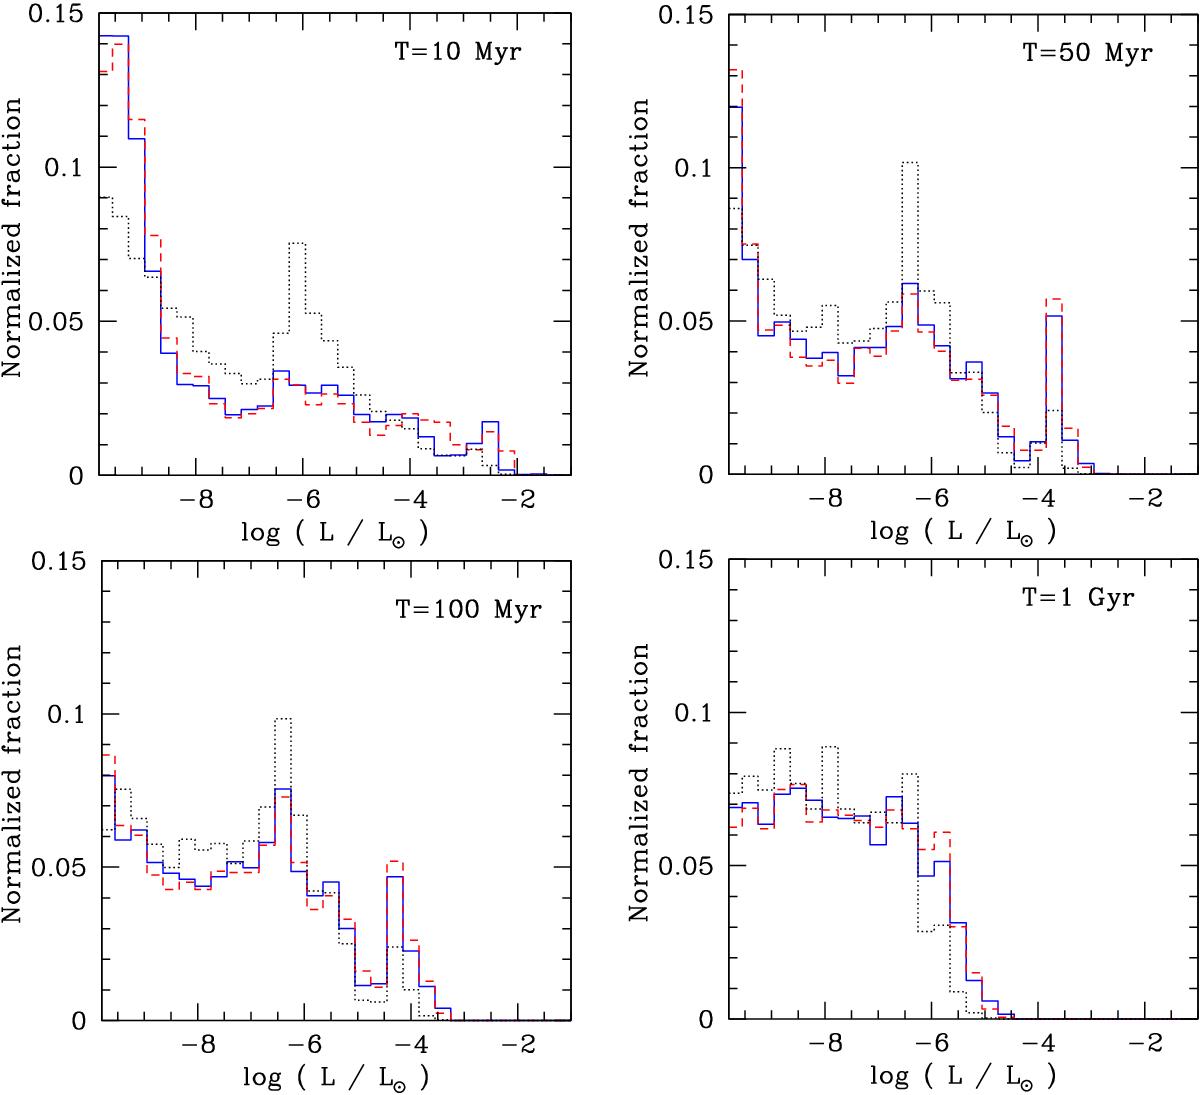
Distribution of planetary luminosities during the evolutionary phase at 10, 50, 100 Myr and 1 Gyr. The cold-nominal (blue solid), the hot (red dashed), and the cold-classical population (black dotted line) are shown. All these populations have similar mass distributions (except for an certain absence of the most massive planets in the cold-classical population) such that the different luminosity distributions are a consequence of the different entropies, and not masses, of the planets in the three populations. The peak at around log (L/L⊙) = −6 in the cold-nominal population clearly distinguishes this population from the other two.
Current usage metrics show cumulative count of Article Views (full-text article views including HTML views, PDF and ePub downloads, according to the available data) and Abstracts Views on Vision4Press platform.
Data correspond to usage on the plateform after 2015. The current usage metrics is available 48-96 hours after online publication and is updated daily on week days.
Initial download of the metrics may take a while.