Fig. 16
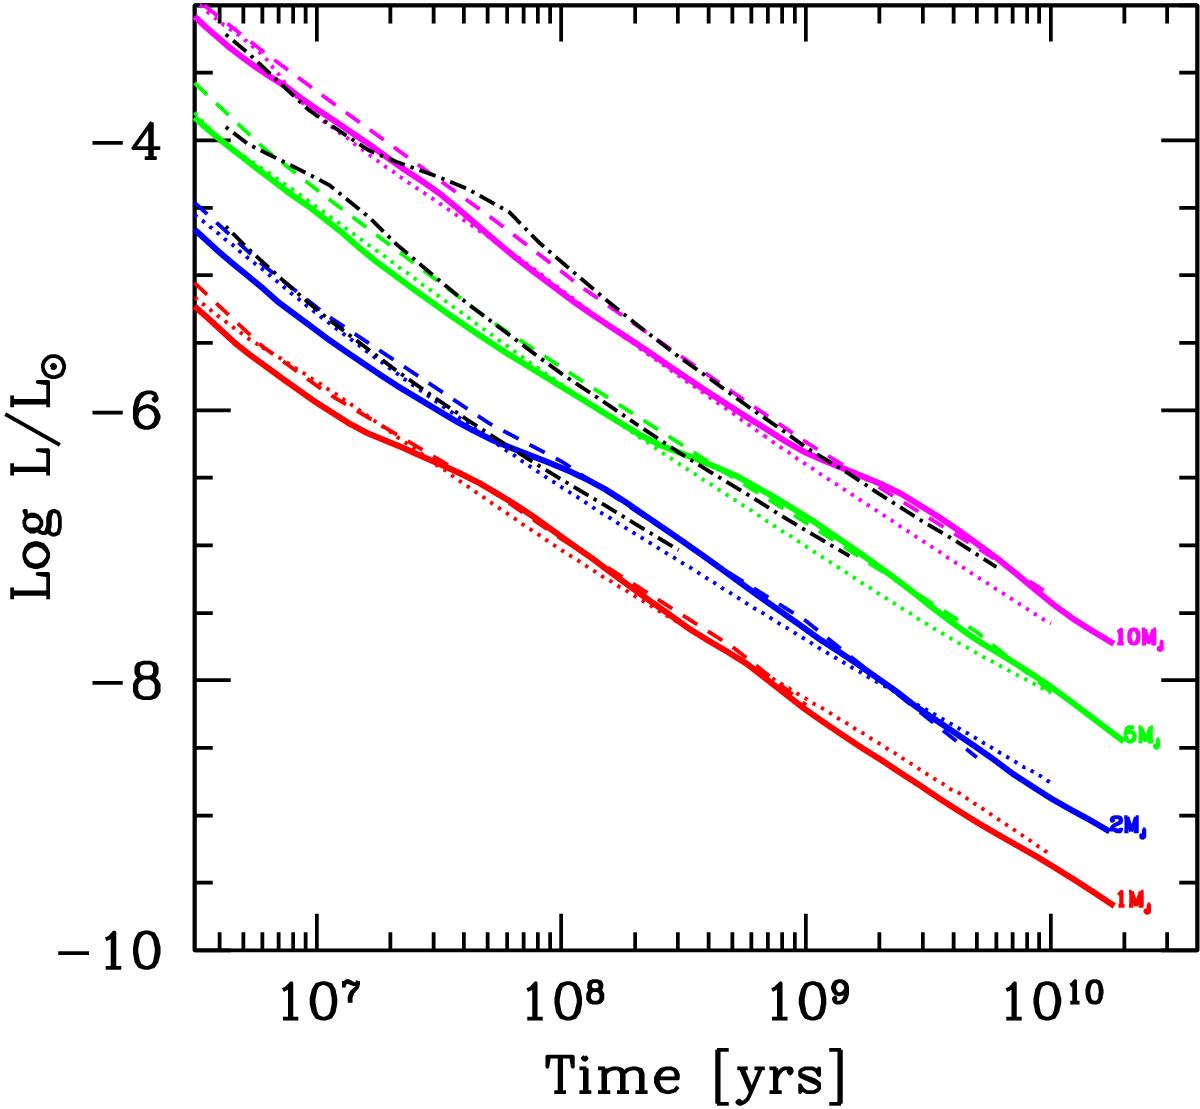
Luminosity as a function of time for giant planets at 5.2 AU during the evolutionary phase. The thick solid lines show the model used for this work. Note the bump in the luminosity at log (L/L⊙) ≈ −6.5. The dotted lines show for comparison the results of Burrows et al. (1997), while the dashed lines show Baraffe et al. (2003). The black dash-dotted lines finally are the more modern hybrid models of Saumon & Marley (2008).
Current usage metrics show cumulative count of Article Views (full-text article views including HTML views, PDF and ePub downloads, according to the available data) and Abstracts Views on Vision4Press platform.
Data correspond to usage on the plateform after 2015. The current usage metrics is available 48-96 hours after online publication and is updated daily on week days.
Initial download of the metrics may take a while.