Fig. 12
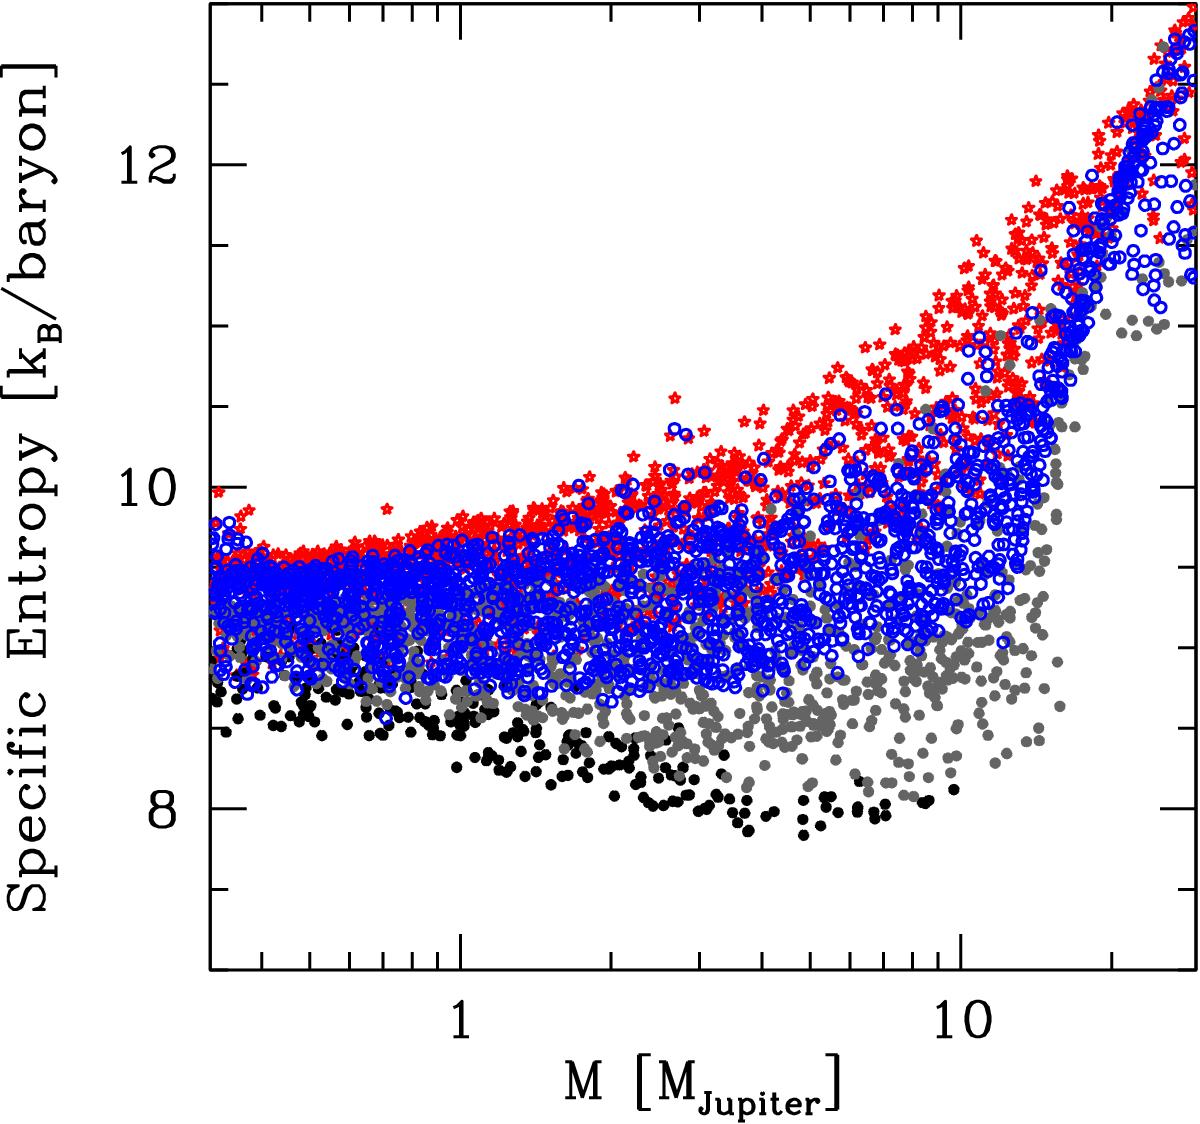
Entropy “tuning fork” diagram, i.e., specific entropy in the convective zone as a function of planet mass at the end of the formation phase when the protoplanetary disk disappears (t = tdisk). The blue empty circles are the cold-nominal population. The red stars are the hot population. The black and gray points show the cold-classical population. For this population, planets with Mcore ≤ 17 M⊕ are shown with black points, mimicking Marley et al. (2007). Planets with Mcore > 17 M⊕ are displayed as gray points.
Current usage metrics show cumulative count of Article Views (full-text article views including HTML views, PDF and ePub downloads, according to the available data) and Abstracts Views on Vision4Press platform.
Data correspond to usage on the plateform after 2015. The current usage metrics is available 48-96 hours after online publication and is updated daily on week days.
Initial download of the metrics may take a while.