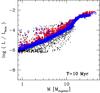
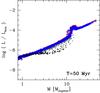
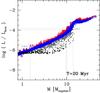
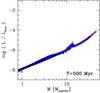
Fig. 11
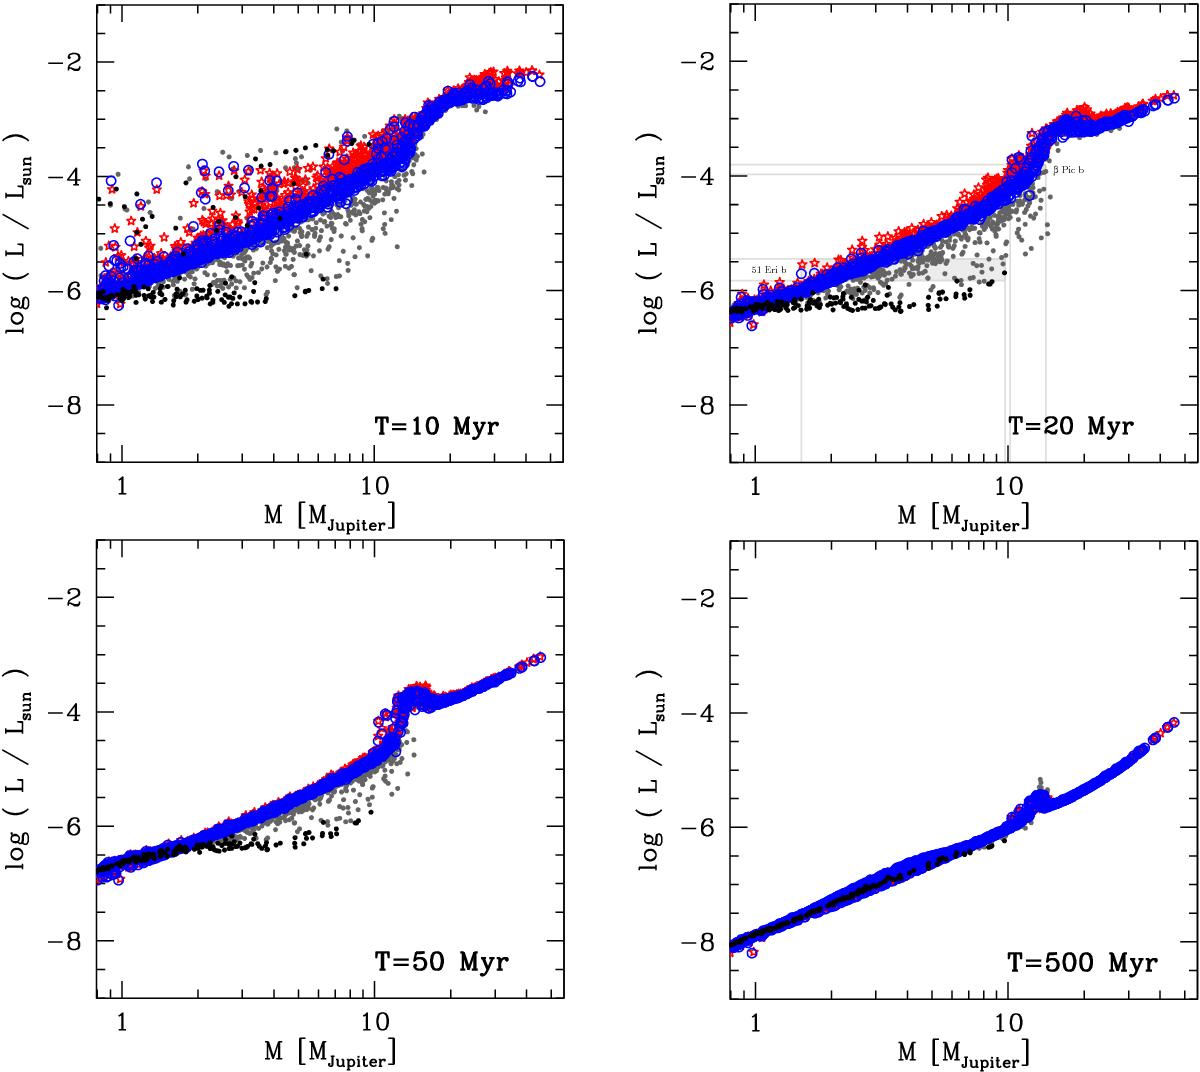
Impact of hot and cold accretion, and of the core mass on the temporal evolution of the planetary M−total L diagram. The blue empty circles are the cold-nominal population. The red stars are the hot population with hot gas accretion and otherwise identical assumptions. The black and gray filled circles represent planets in the cold-classical population. Planets with a core mass of less than 17 M⊕ in this population are shown with black dots and those with a core mass above than 17 M⊕ in gray. This mimics the classical cold start models of Marley et al. (2007). In the panel at 20 Myr the lines shows possible M−L relations for β Pictoris b and 51 Eridani b.
Current usage metrics show cumulative count of Article Views (full-text article views including HTML views, PDF and ePub downloads, according to the available data) and Abstracts Views on Vision4Press platform.
Data correspond to usage on the plateform after 2015. The current usage metrics is available 48-96 hours after online publication and is updated daily on week days.
Initial download of the metrics may take a while.