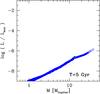
Fig. 10
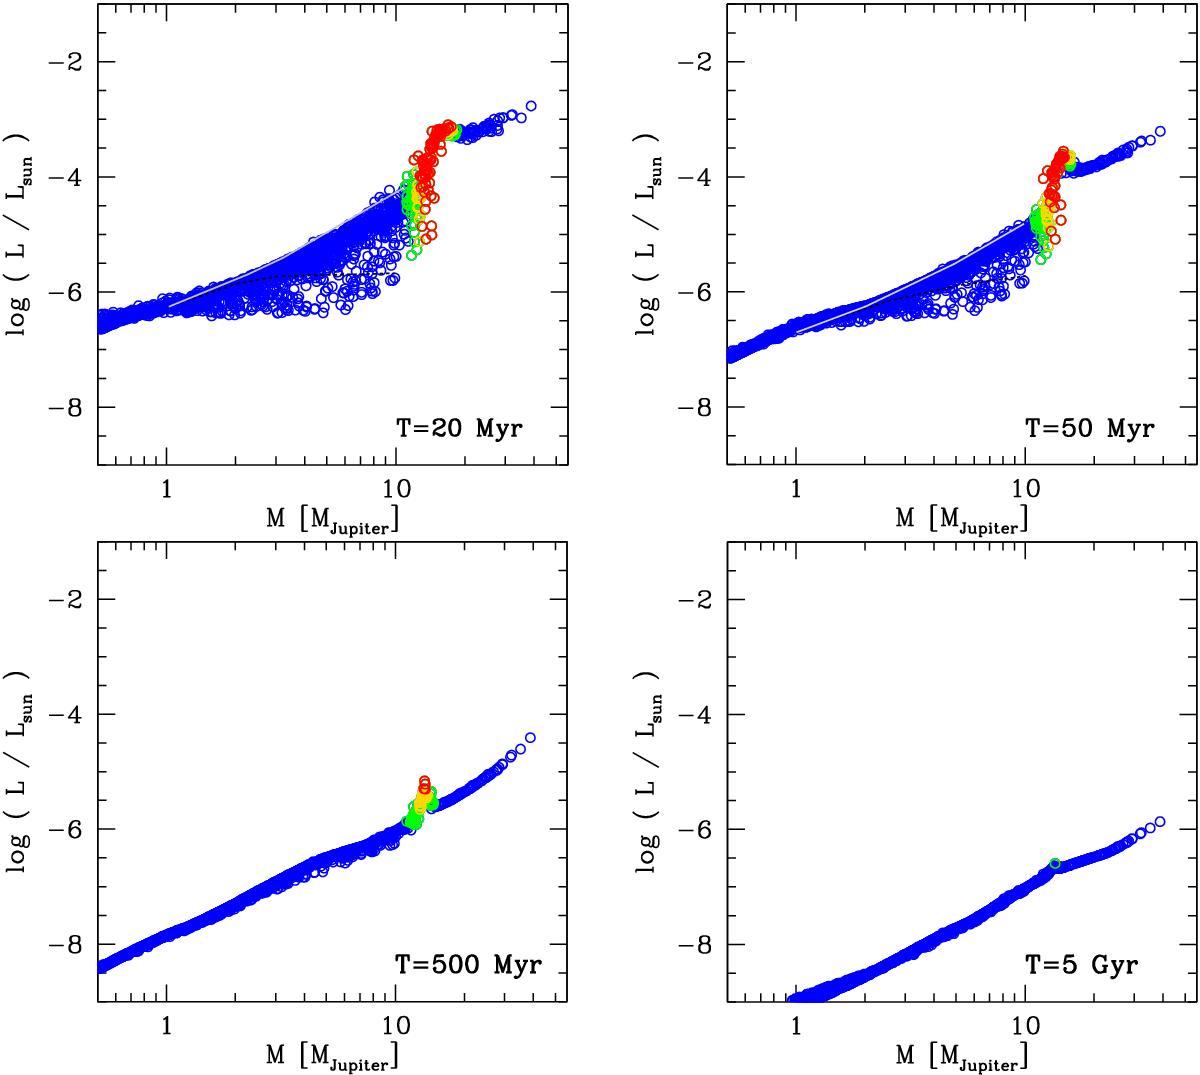
The M–L relationship during the evolutionary phase at constant mass for the cold-classical (low core mass) population, analogous to Fig. 8. In the panel at 20 and 50 Myr, the gray solid and black dashed lines show the M−L relation of classical hot start (Burrows et al. 1997) and cold start (Marley et al. 2007) models, respectively.
Current usage metrics show cumulative count of Article Views (full-text article views including HTML views, PDF and ePub downloads, according to the available data) and Abstracts Views on Vision4Press platform.
Data correspond to usage on the plateform after 2015. The current usage metrics is available 48-96 hours after online publication and is updated daily on week days.
Initial download of the metrics may take a while.