Fig. 1
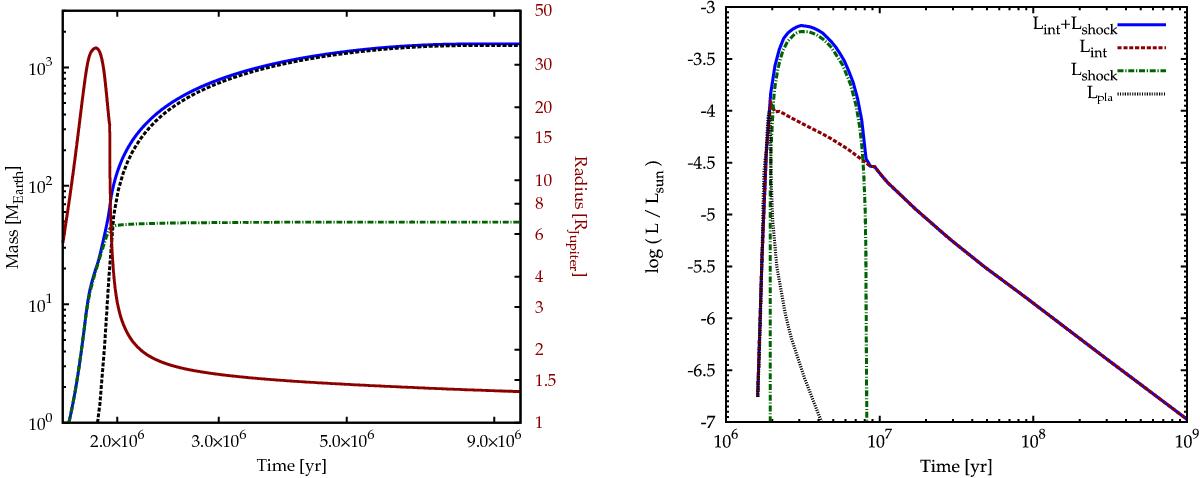
Illustrative example of the formation and evolution of a 5 M♃ planet. Left panel: total (blue solid), core (green dash-dotted), and envelope mass (black dashed line) as a function of time during the formation phase. These lines belong to the left y-axis. The solid brown line shows the planetary radius (right y-axis). Right panel: luminosity as a function of time during the formation and subsequent evolutionary phase. The total luminosity (blue solid) and the individual contributions from the internal luminosity (brown dashed), the accretion shock (green dash-dotted), and the planetesimal accretion (black dashed line) are shown.
Current usage metrics show cumulative count of Article Views (full-text article views including HTML views, PDF and ePub downloads, according to the available data) and Abstracts Views on Vision4Press platform.
Data correspond to usage on the plateform after 2015. The current usage metrics is available 48-96 hours after online publication and is updated daily on week days.
Initial download of the metrics may take a while.