Fig. 7
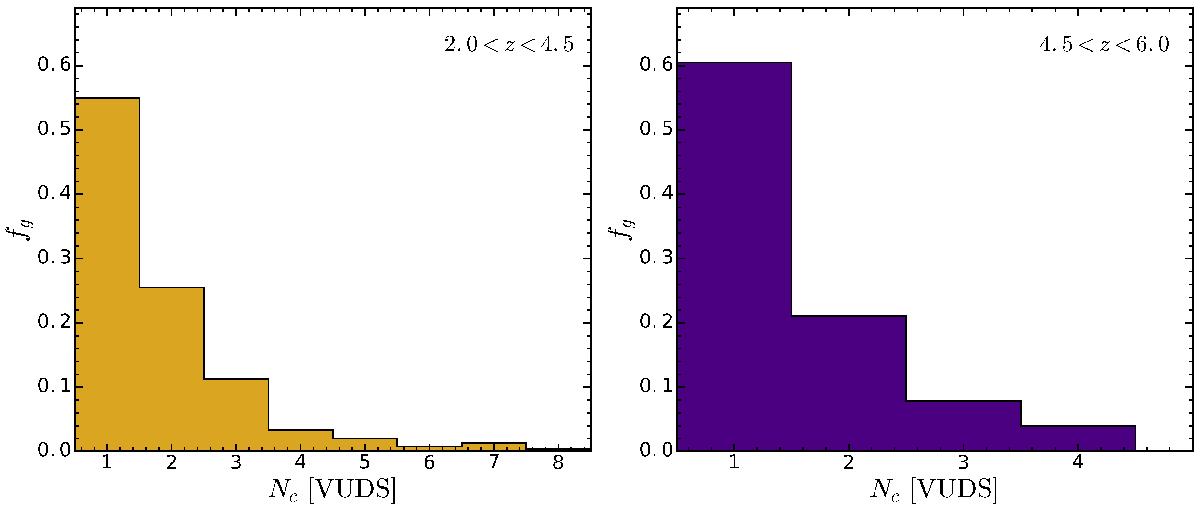
Number of galaxies as a function of the number of clumps detected within the selected isophote. We note that we include in this plot single clump galaxies which correspond to galaxies with no substructure or a single central clump. We plot this quantity for two redshift intervals each with its respective value of kp = 1.5 for 2 < z < 4.5 in gold (left panel) and kp = 5 for 4.5 < z < 6.0 in purple (right panel). On each panel we show the number of clumps for the VUDS targets.
Current usage metrics show cumulative count of Article Views (full-text article views including HTML views, PDF and ePub downloads, according to the available data) and Abstracts Views on Vision4Press platform.
Data correspond to usage on the plateform after 2015. The current usage metrics is available 48-96 hours after online publication and is updated daily on week days.
Initial download of the metrics may take a while.