Fig. 11
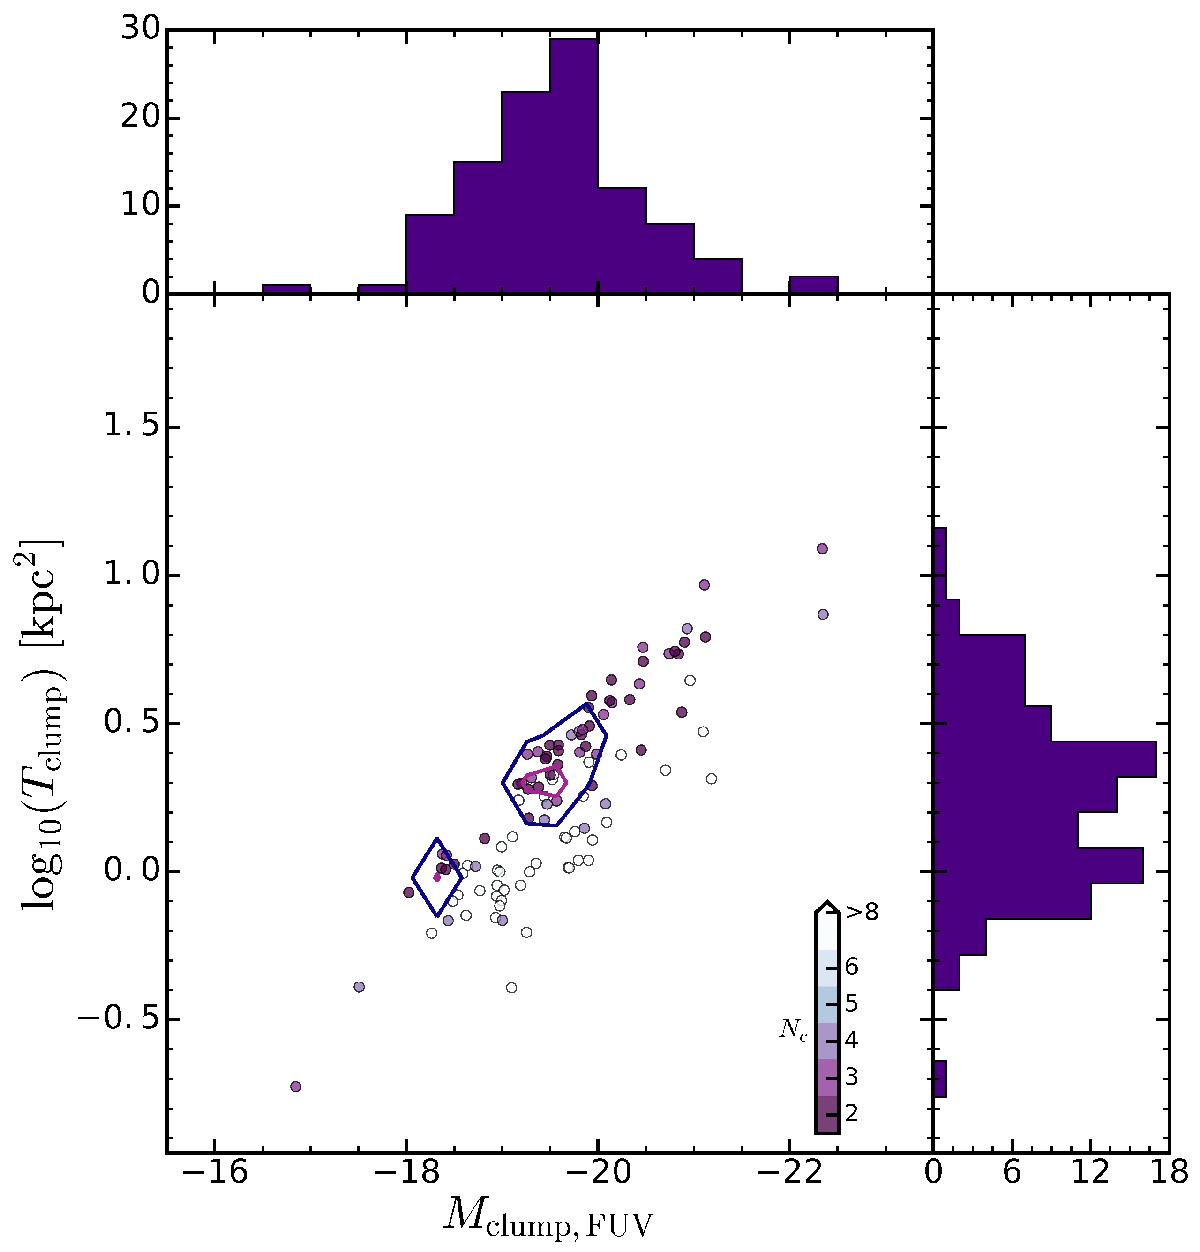
Absolute magnitude in rest-frame FUV and area distribution for clumps found in galaxies with Nc ≥ 2 detected at 4.5 <z < 6.0 with kp = 5. Each clump is color coded by the number of clumps found in its parent galaxy. The color scheme is found at the bottom right of the main panel. The contours shows the distribution of fraction of two-clump systems at levels of 10% and 25%.
Current usage metrics show cumulative count of Article Views (full-text article views including HTML views, PDF and ePub downloads, according to the available data) and Abstracts Views on Vision4Press platform.
Data correspond to usage on the plateform after 2015. The current usage metrics is available 48-96 hours after online publication and is updated daily on week days.
Initial download of the metrics may take a while.