Fig. 3
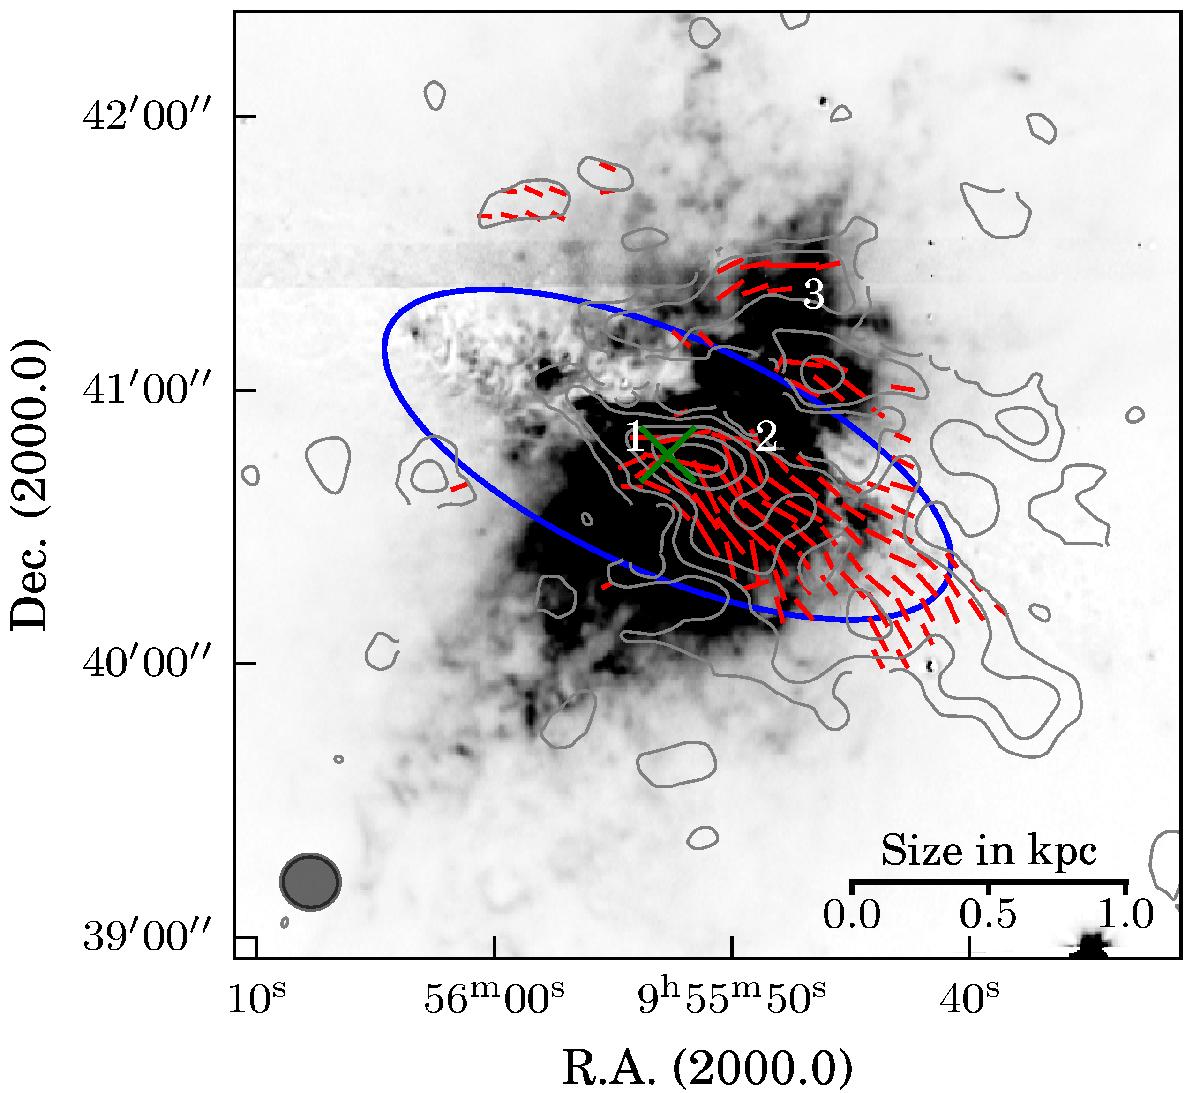
Polarised flux density contours at λ6 cm overlaid on a Hα image from the WIYN Observatory. Contour levels are at 80, 120, 200, 300, 400 μJy beam-1. In the lower left we show the size of the synthesised beam (12.̋5 × 11.̋7). The red vectors indicate the measured polarised flux density (1″ = 40 μJy beam-1) and the intrinsic magnetic field direction of the emission. The green cross marks the optical centre of M 82 and the blue ellipse the extent of the central optical disk.
Current usage metrics show cumulative count of Article Views (full-text article views including HTML views, PDF and ePub downloads, according to the available data) and Abstracts Views on Vision4Press platform.
Data correspond to usage on the plateform after 2015. The current usage metrics is available 48-96 hours after online publication and is updated daily on week days.
Initial download of the metrics may take a while.