Fig. 8
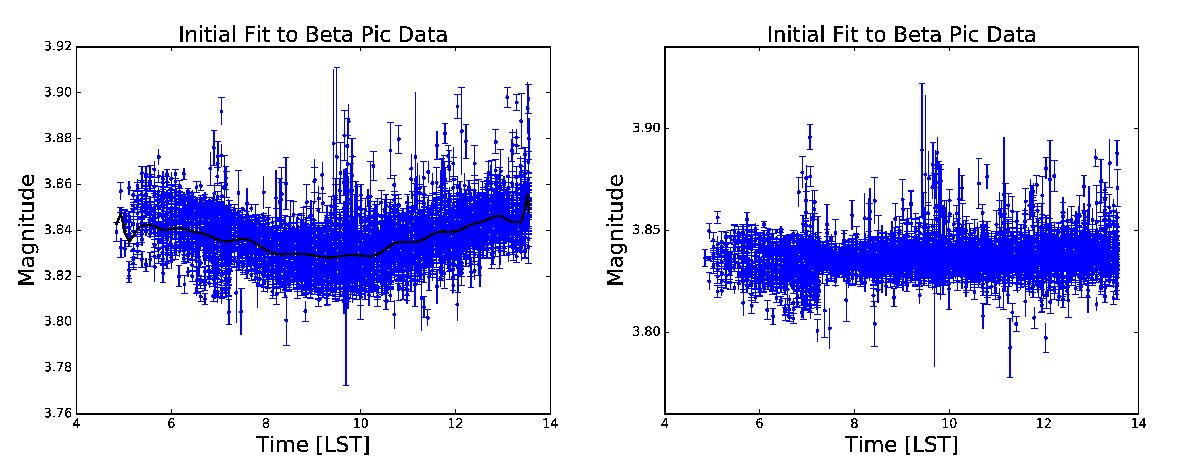
An example data set taken from both cameras, showing the application of the LST correction. The left hand panel is the photometry of β Pictoris over two weeks and plotted as a function of LST. The blue values show the original data, and the black values show the calculated correction function. The right hand panel shows the same photometry after the LST flux correction is applied.
Current usage metrics show cumulative count of Article Views (full-text article views including HTML views, PDF and ePub downloads, according to the available data) and Abstracts Views on Vision4Press platform.
Data correspond to usage on the plateform after 2015. The current usage metrics is available 48-96 hours after online publication and is updated daily on week days.
Initial download of the metrics may take a while.