Fig. 3
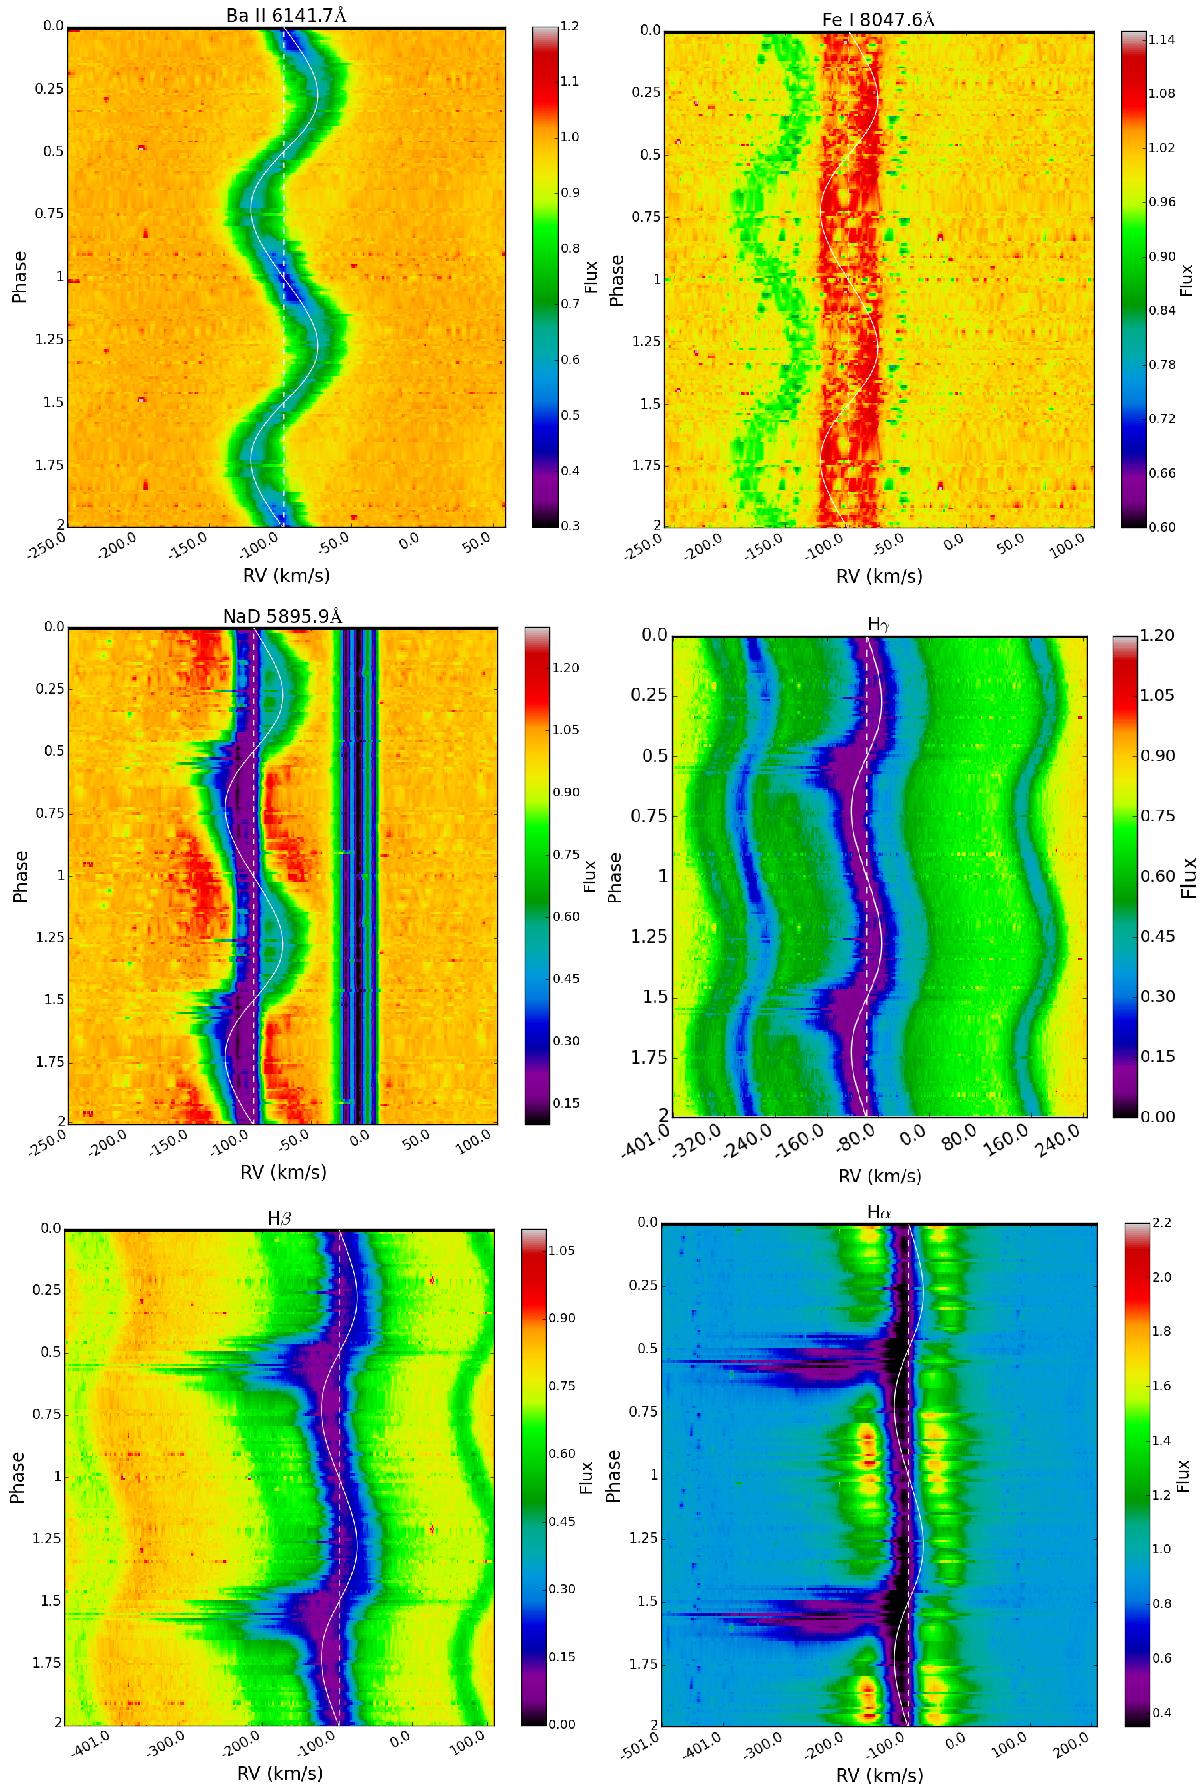
Dynamic spectra of Ba II, Fe I, NaD, Hγ, Hβ, and Hα of BD+46°442 as a function of orbital phase, showing different phase-dependent variations in the line profiles. The velocity on the x-axis denotes the RV shift from the laboratory wavelength. The white dashed line represents the systemic velocity, and the white full line represents the RV curve of the primary component. The colour indicates the continuum-normalised flux.
Current usage metrics show cumulative count of Article Views (full-text article views including HTML views, PDF and ePub downloads, according to the available data) and Abstracts Views on Vision4Press platform.
Data correspond to usage on the plateform after 2015. The current usage metrics is available 48-96 hours after online publication and is updated daily on week days.
Initial download of the metrics may take a while.