Fig. 17
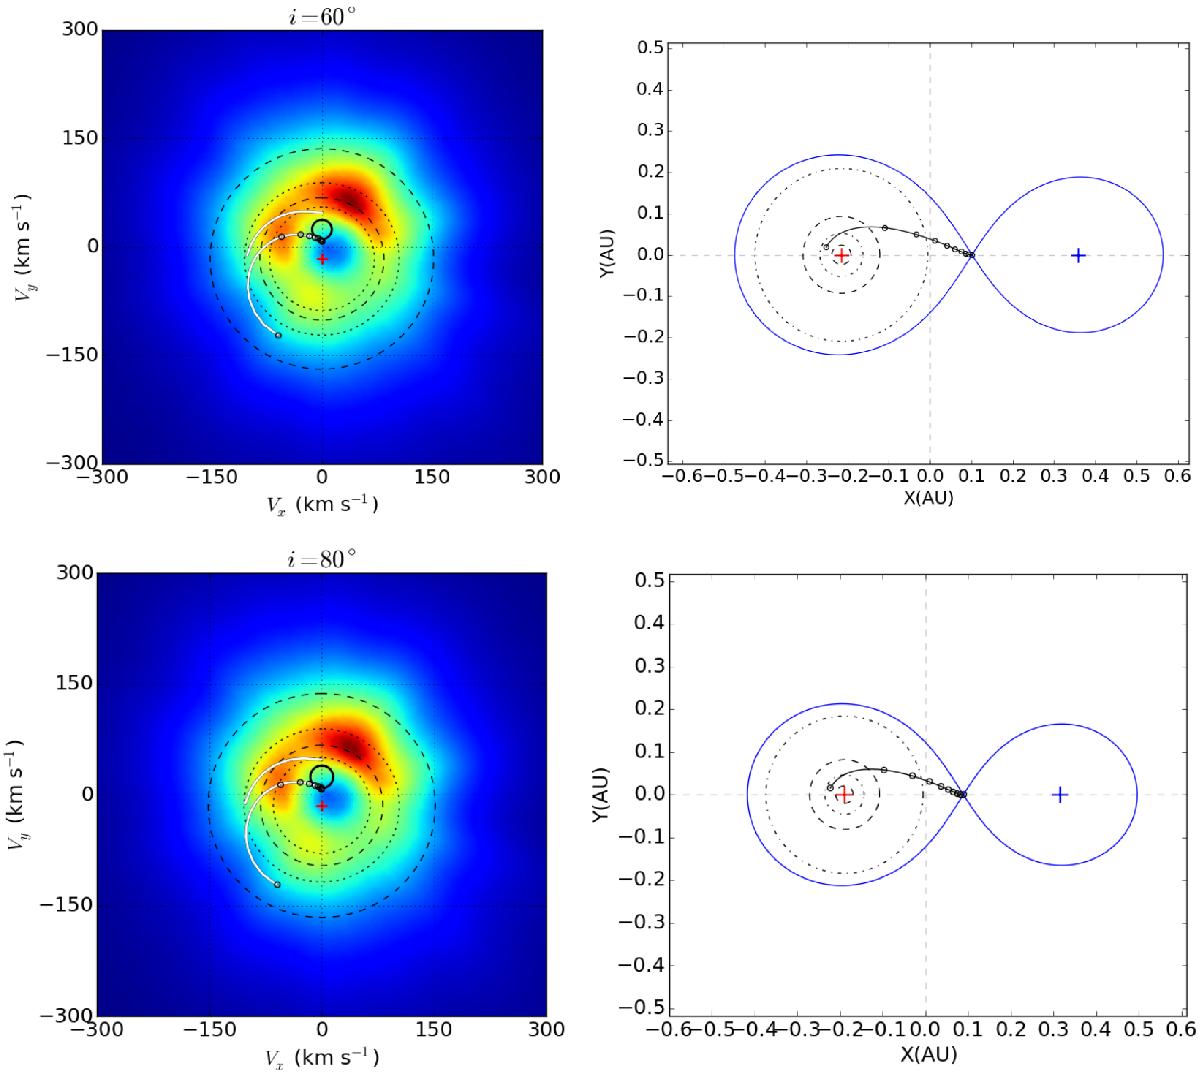
Doppler tomograph of BD+46°442 in Hα (left) and the corresponding accretion geometry (right). The map is overplotted with the velocity coordinates of the model for inclination angles of 60° (top left) and 80° (bottom left). The curves shown are similar as for Fig. 15. The points marked on the ballistic trajectory in the geometrical image correspond to the points marked on the curve representing the ballistic trajectory of the gas stream in the Doppler map. The four circles on the Doppler map represent, from outside to inside, a projected Keplerian velocity of 150, 100, 75, and 50 km s-1, respectively. These correspond to the four circles on the geometrical image.
Current usage metrics show cumulative count of Article Views (full-text article views including HTML views, PDF and ePub downloads, according to the available data) and Abstracts Views on Vision4Press platform.
Data correspond to usage on the plateform after 2015. The current usage metrics is available 48-96 hours after online publication and is updated daily on week days.
Initial download of the metrics may take a while.