Fig. 13
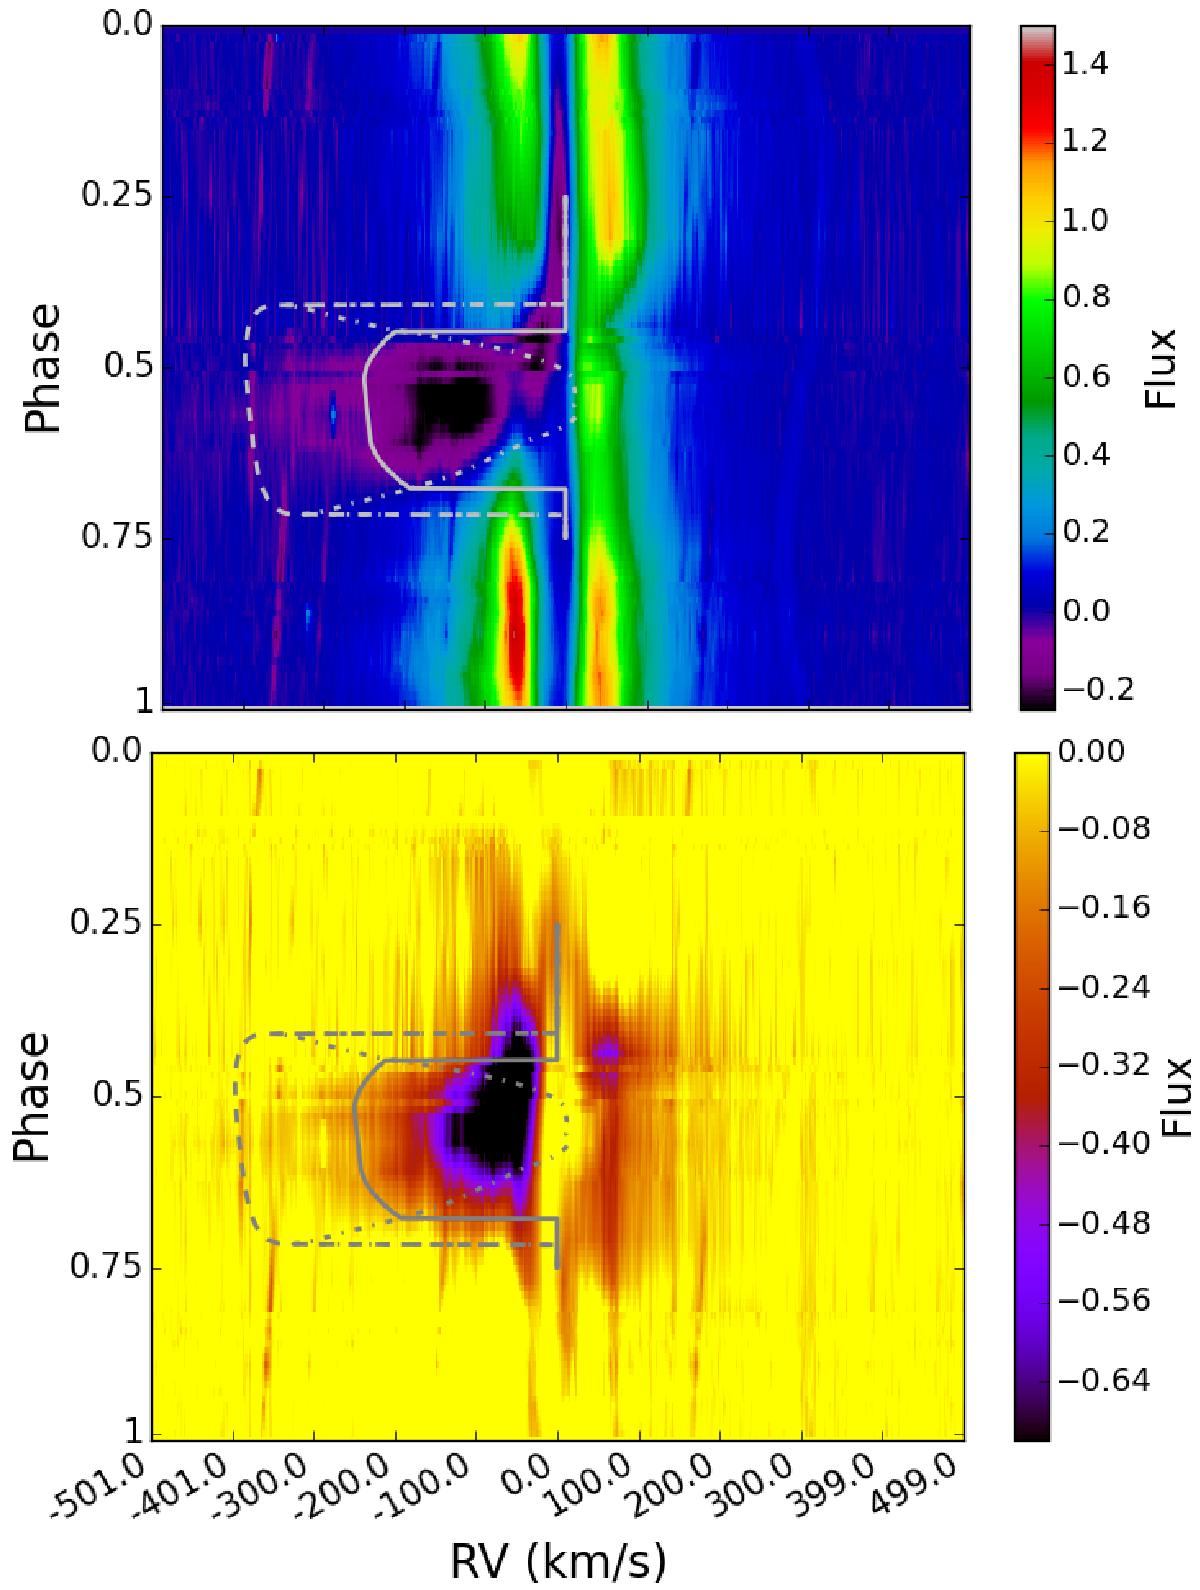
Projected line-of-sight velocity for the constant velocity profile. These are plotted over the normalised dynamic spectra of the Hα profile of BD+46°442 observed between BJD = 2 455 790 d and BJD = 2 456 000 d. The upper panel shows the observed spectra corrected for the photospheric contribution of the primary. The lower panel is the difference between the photospheric corrected spectra and a template spectrum taken at phase φ = 0.09, representing the variations in the strength of the absorption feature as a function of orbital phase. The continuum corresponds to a flux value of zero. Hence, absorption is represented by negative flux values and emission by positive values. The grey curves correspond to ![]() (full line),
(full line), ![]() (dash-dotted line), and
(dash-dotted line), and ![]() (dashed line).
(dashed line).
Current usage metrics show cumulative count of Article Views (full-text article views including HTML views, PDF and ePub downloads, according to the available data) and Abstracts Views on Vision4Press platform.
Data correspond to usage on the plateform after 2015. The current usage metrics is available 48-96 hours after online publication and is updated daily on week days.
Initial download of the metrics may take a while.