Fig. 8
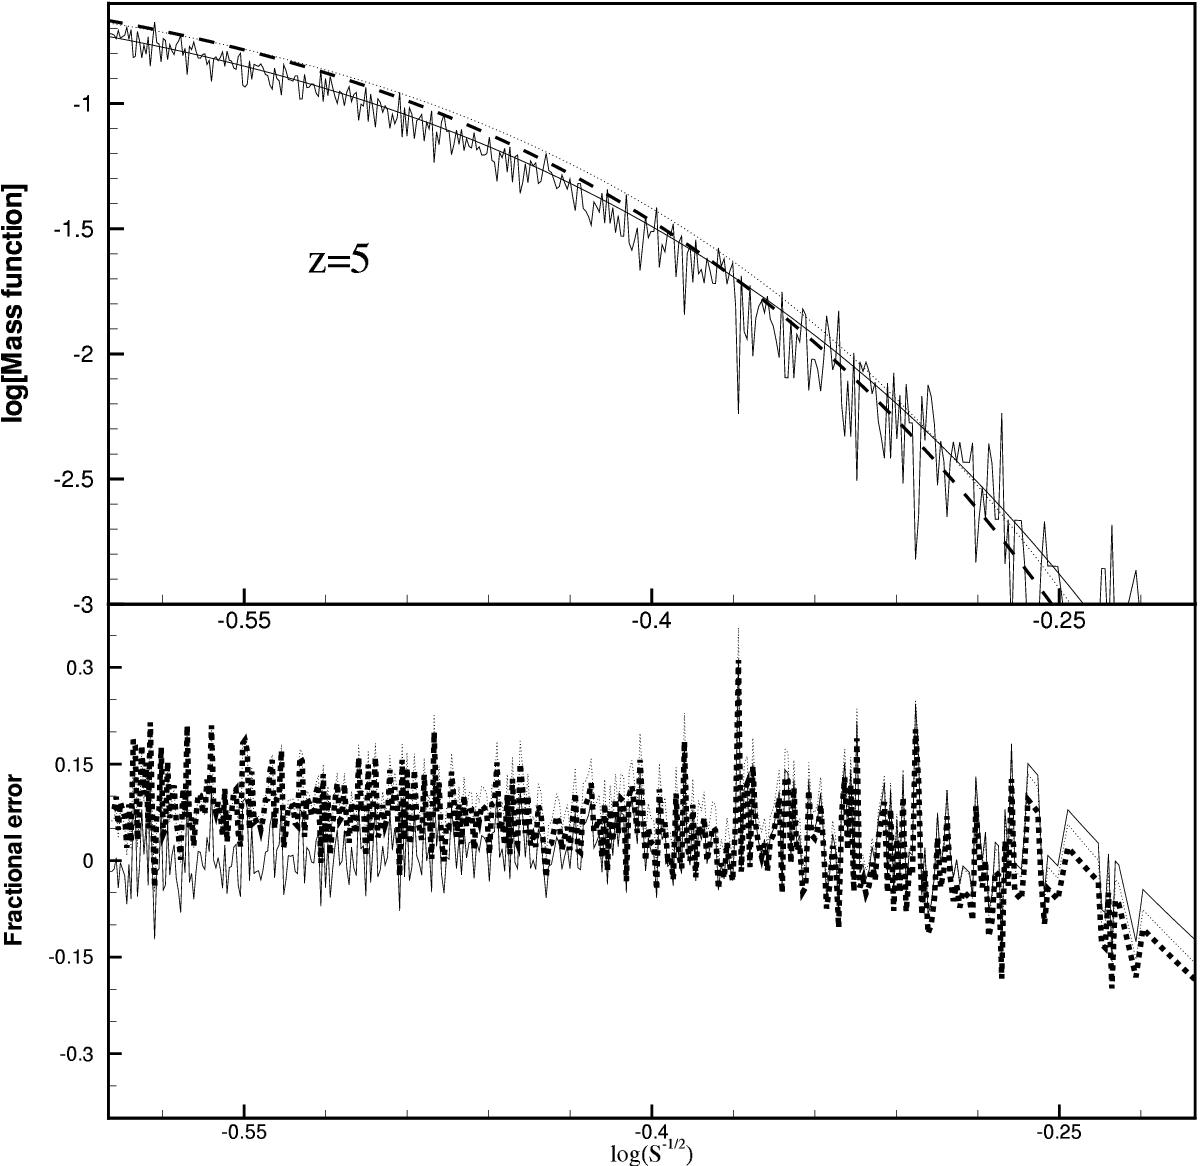
Upper snapshot: mass functions at redshift z = 5. The noisy solid line shows our results (a = 0.796,p = 0.866). The smooth solid line shows the model of Sheth et al. (2001). Dashed line represents the results of Warren et al. (2006) while dotted line shows the results of Watson et al. (2013). Lower snapshot: fractional errors between our results and the model of Sheth et al. (2001), solid line, between our results and the model of Warren et al. (2006), dashed line, and between our results and the model of Watson et al. (2013), dotted line.
Current usage metrics show cumulative count of Article Views (full-text article views including HTML views, PDF and ePub downloads, according to the available data) and Abstracts Views on Vision4Press platform.
Data correspond to usage on the plateform after 2015. The current usage metrics is available 48-96 hours after online publication and is updated daily on week days.
Initial download of the metrics may take a while.