Fig. 4
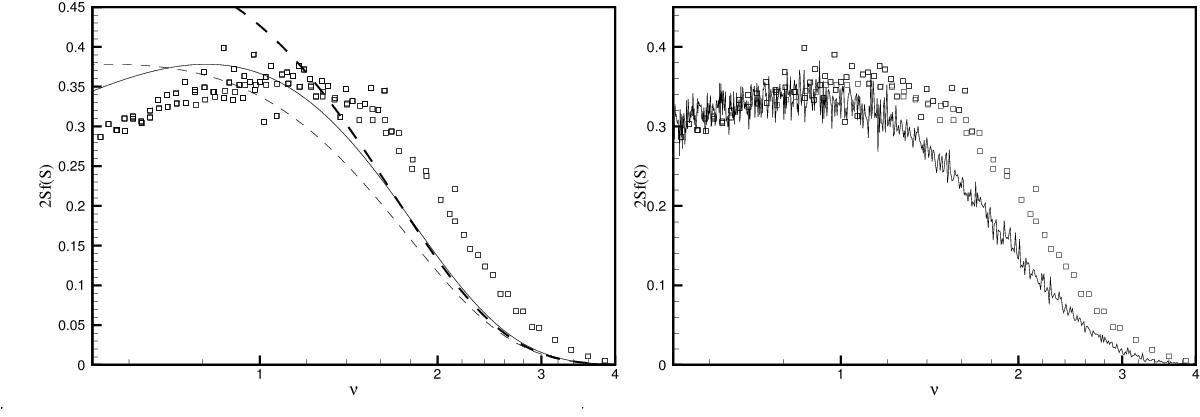
Comparison of the results of N-body simulations, squares, with those of analytical formulae of Eqs. (17) and (18), and with our predictions. Left snapshot: squares are the results of N-body simulations. The predictions of Eq. (17) are represented by the smooth solid line while the predictions of Eq. (18) for Γ = 1/3 and Γ = 1/2 are represented by the dashed lines (large dashes and small dashes respectively). Right snapshot: squares are the results of N-body simulations. The results of our Monte Carlo simulations are given by the solid line.
Current usage metrics show cumulative count of Article Views (full-text article views including HTML views, PDF and ePub downloads, according to the available data) and Abstracts Views on Vision4Press platform.
Data correspond to usage on the plateform after 2015. The current usage metrics is available 48-96 hours after online publication and is updated daily on week days.
Initial download of the metrics may take a while.