Fig. 6
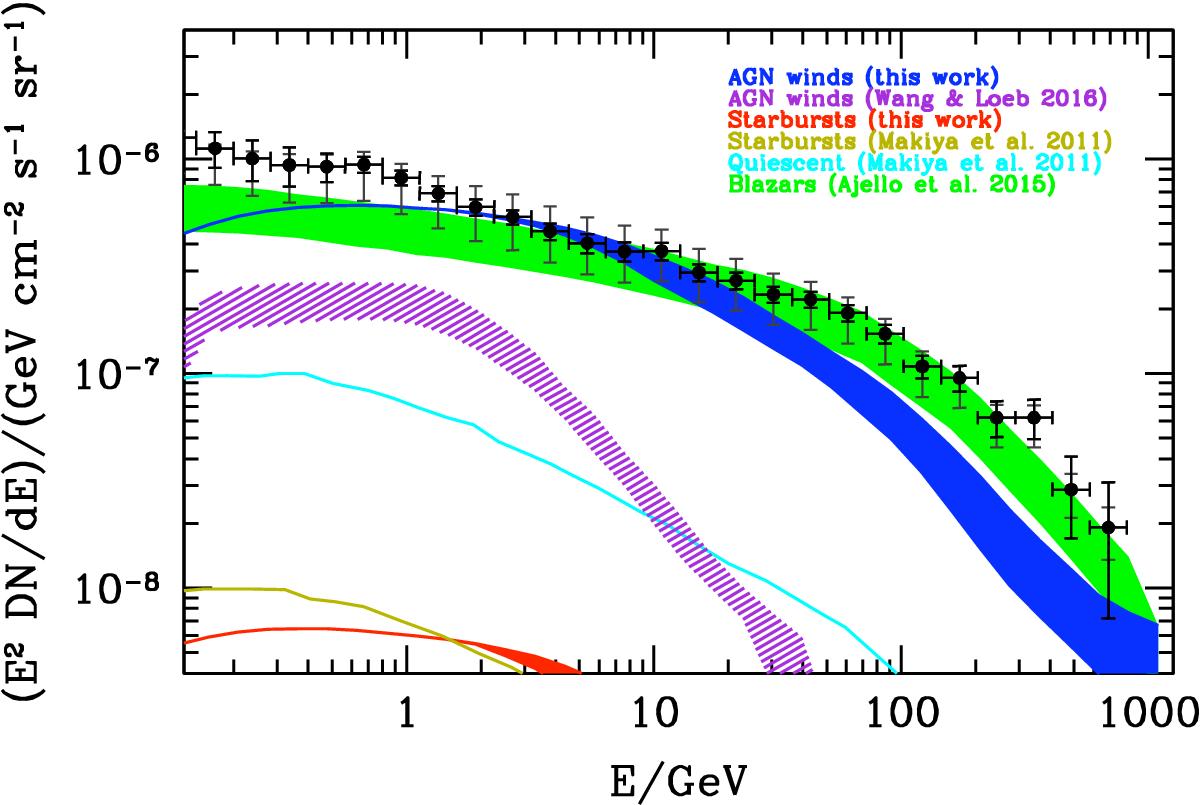
EGB spectrum. The blue and red shaded regions correspond to AGN winds and starburst galaxies predicted by our SAM, respectively. The purple shaded region corresponds to the contribution to the EGB from AGN winds estimated by Wang & Loeb (2016a). The cyan and gold lines indicate the estimate for quiescent and starburst galaxies, respectively, predicted by the Makiya et al. (2011) SAM. The green shaded region shows the contribution to the EGB from blazars as estimated by Ajello et al. (2015). The data points are as in Fig. 4.
Current usage metrics show cumulative count of Article Views (full-text article views including HTML views, PDF and ePub downloads, according to the available data) and Abstracts Views on Vision4Press platform.
Data correspond to usage on the plateform after 2015. The current usage metrics is available 48-96 hours after online publication and is updated daily on week days.
Initial download of the metrics may take a while.