Fig. 5
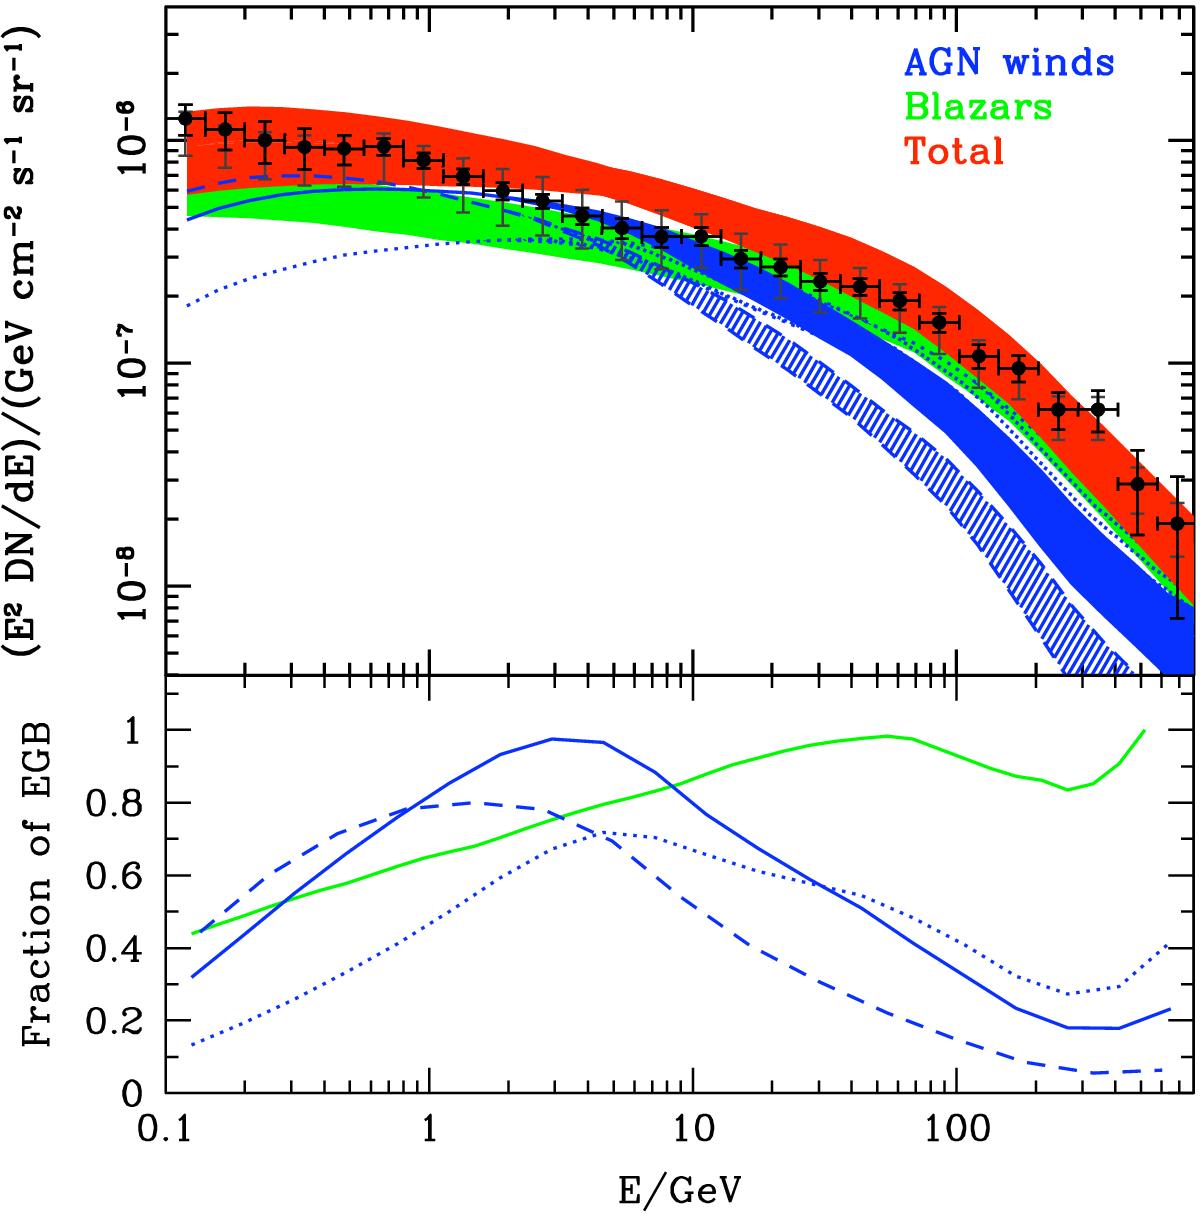
Upper panel: the contribution to the EGB from AGN winds predicted by our SAM is compared to the contribution provided by the blazar population (Ajello et al. 2015). Model predictions are shown for our fiducial model and for different accelerated proton spectral index: p = 2 (dotted blue lines), p = 2.2 (solid blue lines), and p = 2.4 (dashed blue lines). The red shaded region represent the sum of the AGN wind and blazar contributions to the EGB. The data points are as in Fig. 4. Lower panel: fraction of EGB provided by AGN winds and blazars.
Current usage metrics show cumulative count of Article Views (full-text article views including HTML views, PDF and ePub downloads, according to the available data) and Abstracts Views on Vision4Press platform.
Data correspond to usage on the plateform after 2015. The current usage metrics is available 48-96 hours after online publication and is updated daily on week days.
Initial download of the metrics may take a while.